Label the closest point on the alpha hull of the data.
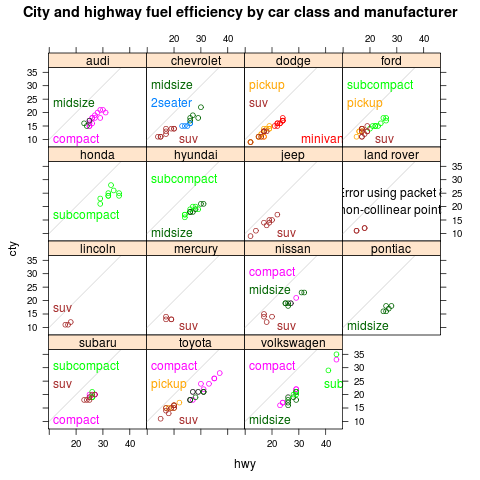 |
class-manufacturer
data(mpg,package="ggplot2")
m <- lm(cty~displ,data=mpg)
mpgf <- fortify(m,mpg)
library(lattice)
library(latticeExtra)
p <- xyplot(cty~hwy|manufacturer,mpgf,groups=class,aspect="iso",
       main="City and highway fuel efficiency by car class and manufacturer")+
  layer_(panel.abline(0,1,col="grey90"))
direct.label(p,"ahull.grid")
|
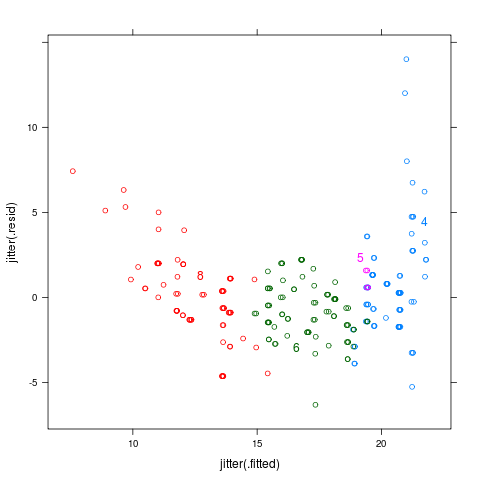 |
cylinders
data(mpg,package="ggplot2")
m <- lm(cty~displ,data=mpg)
mpgf <- fortify(m,mpg)
library(lattice)
p <- xyplot(jitter(.resid)~jitter(.fitted),mpgf,groups=factor(cyl))
direct.label(p,"ahull.grid")
|
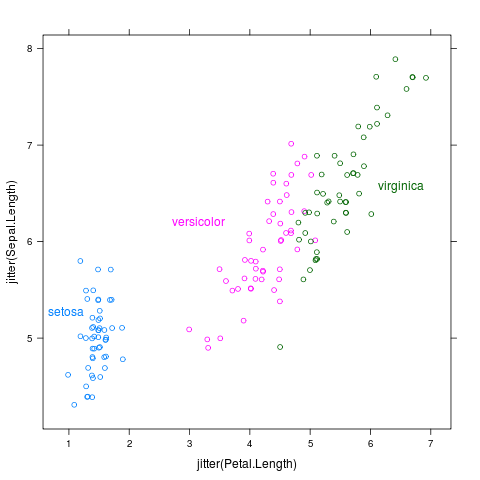 |
iris
library(lattice)
p <- xyplot(jitter(Sepal.Length)~jitter(Petal.Length),iris,groups=Species)
direct.label(p,"ahull.grid")
|
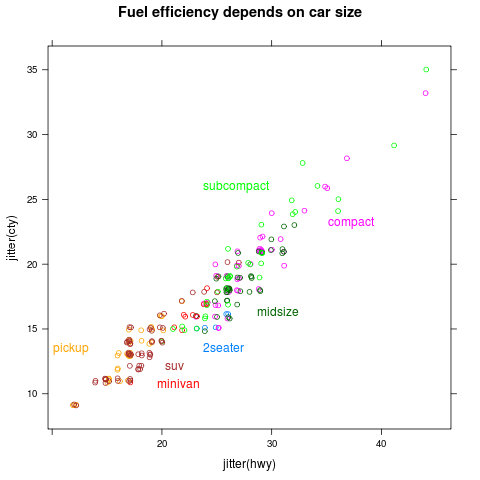 |
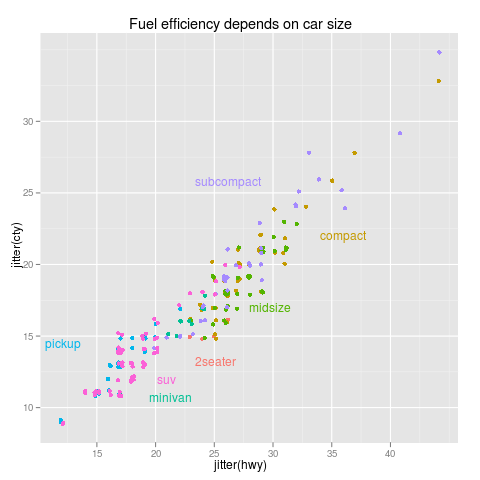
mpglattice
data(mpg,package="ggplot2")
library(lattice)
p <- xyplot(jitter(cty)~jitter(hwy),mpg,groups=class,
       main="Fuel efficiency depends on car size")
direct.label(p,"ahull.grid")
|
 |
mpg
library(ggplot2)
data(mpg,package="ggplot2")
p <- qplot(jitter(hwy),jitter(cty),data=mpg,colour=class,
      main="Fuel efficiency depends on car size")
direct.label(p,"ahull.grid")
|
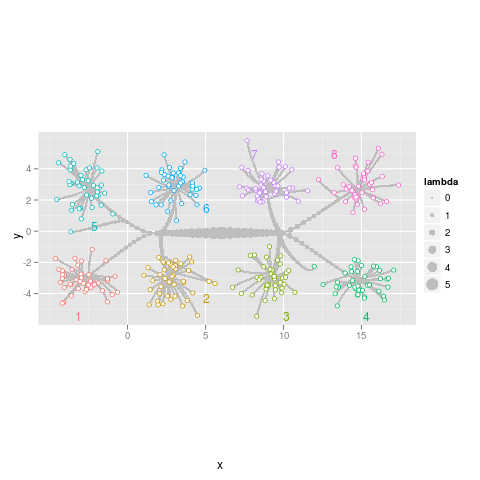 |
path
data(normal.l2.cluster,package="directlabels")
library(ggplot2)
p <- ggplot(normal.l2.cluster$path,aes(x,y))+
  geom_path(aes(group=row),colour="grey")+
  geom_point(aes(size=lambda),colour="grey")+
  geom_point(aes(colour=class),data=normal.l2.cluster$pts,pch=21,fill="white")+
  coord_equal()
direct.label(p,"ahull.grid")
|


