directlabels - scatterplot - example -
class-manufacturer
data(mpg,package="ggplot2")
m <- lm(cty~displ,data=mpg)
mpgf <- fortify(m,mpg)
library(lattice)
library(latticeExtra)
p <- xyplot(cty~hwy|manufacturer,mpgf,groups=class,aspect="iso",
       main="City and highway fuel efficiency by car class and manufacturer")+
  layer_(panel.abline(0,1,col="grey90"))
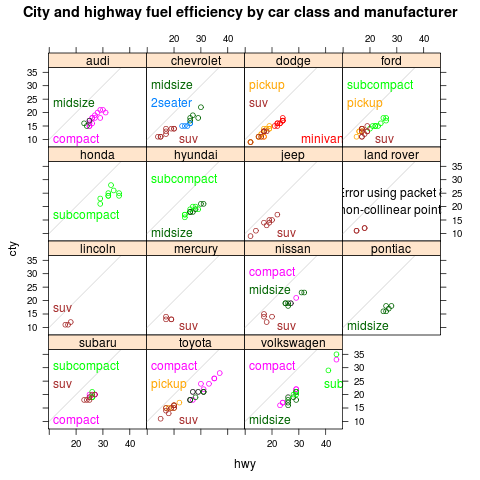 |
Label the closest point on the alpha hull of the data.
direct.label(p,"ahull.grid")
|
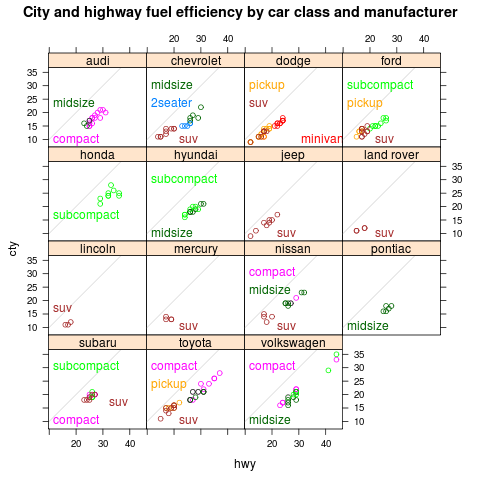 |
Label the closest point on the convex hull of the data.
direct.label(p,"chull.grid")
|
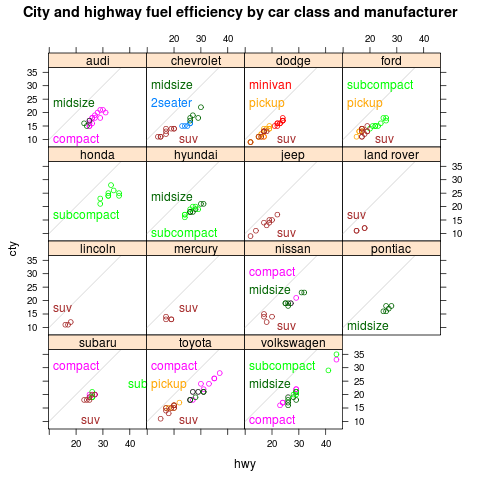 |
Label each point cloud near the extremities of the plot region.
direct.label(p,"extreme.grid")
|
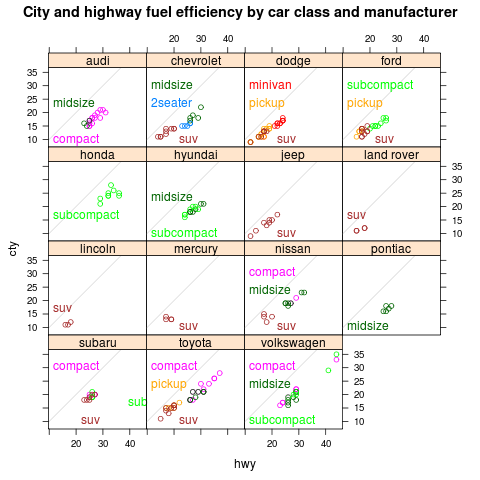 |
Search the plot region for a label position near the center of
each point cloud.
direct.label(p,"smart.grid")
|
| Please
contact Toby
Dylan Hocking if you are
using directlabels
or have ideas to contribute, thanks! |
| Documentation website generated from source
code version 2021.2.24
(git revision bb6db07 Mon, 14 Jun 2021 22:38:45 +0530)
using inlinedocs. |
|
validate
|