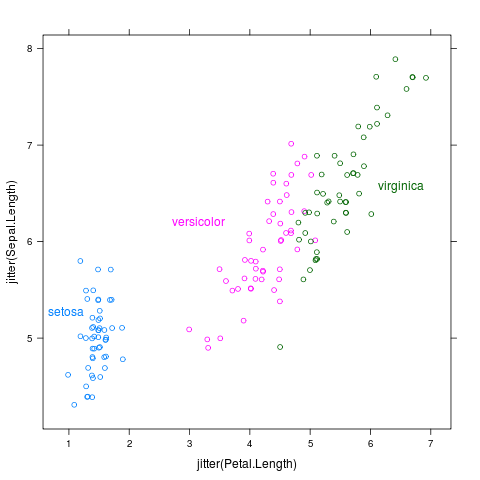
Label the closest point on the alpha hull of the data.
direct.label(p,"ahull.grid")

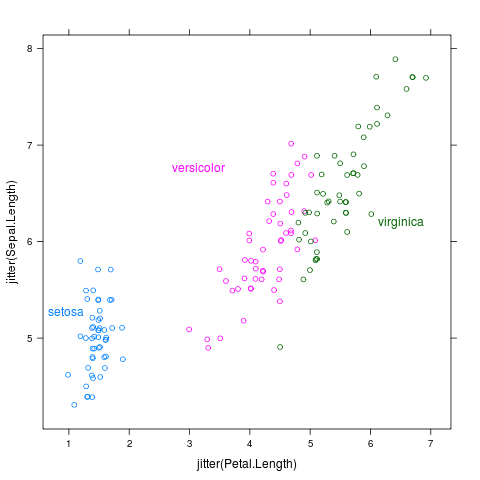
Label the closest point on the convex hull of the data.
direct.label(p,"chull.grid")

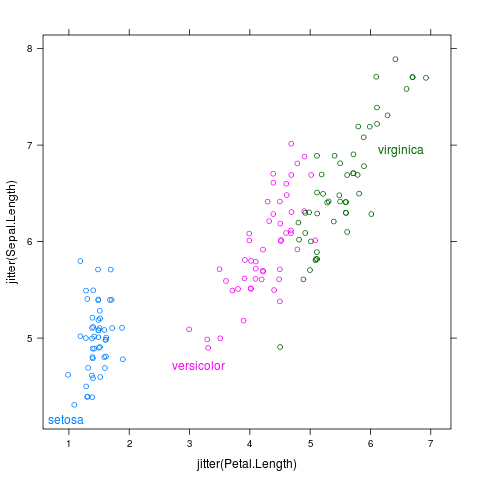
Label each point cloud near the extremities of the plot region.
direct.label(p,"extreme.grid")

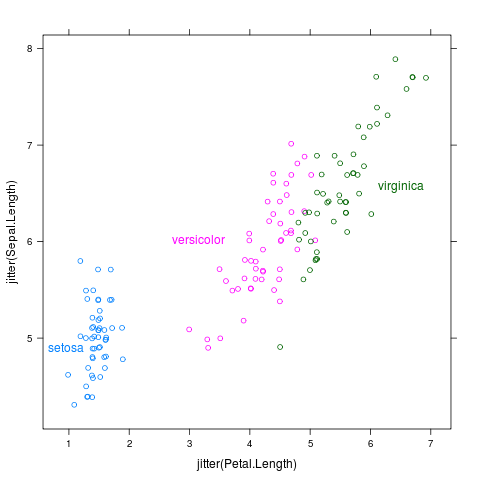
Search the plot region for a label position near the center of each point cloud.
direct.label(p,"smart.grid")