directlabels - dotplot - Positioning Method - angled.endpoints

Useful for labeling lines that all end at the top.

angled.endpoints <- list("last.points",rot=30)
vadeaths-lattice

vadeaths-lattice

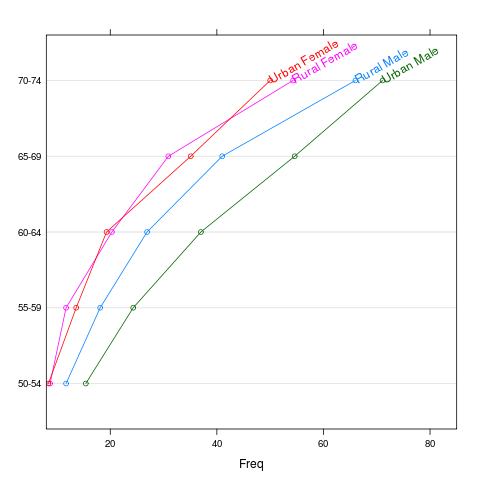
library(lattice)
p <- dotplot(VADeaths,xlim=c(8,85),type="o")
direct.label(p,"angled.endpoints")
  
vadeaths

vadeaths

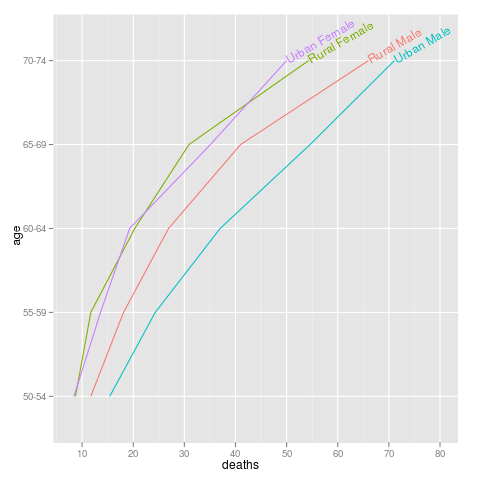
vad <- as.data.frame.table(VADeaths)
names(vad) <- c("age","demographic","deaths")
library(ggplot2)
p <- qplot(deaths,age,data=vad,group=demographic,geom="line",colour=demographic)+
  xlim(8,80)
direct.label(p,"angled.endpoints")
  
Please contact Toby Dylan Hocking if you are using directlabels or have ideas to contribute, thanks!
Documentation website generated from source code version 2021.2.24 (git revision bb6db07 Mon, 14 Jun 2021 22:38:45 +0530) using inlinedocs.
validate