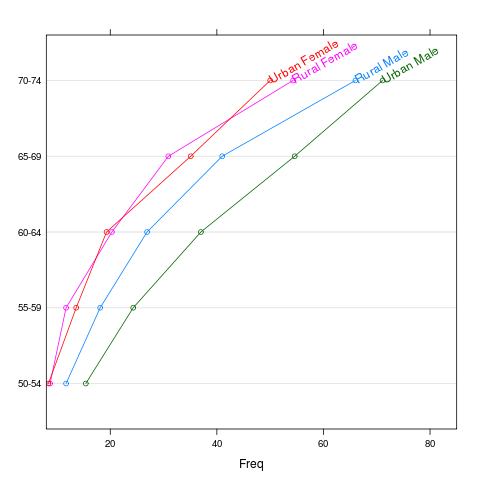
Useful for labeling lines that all end at the top.
direct.label(p,"angled.endpoints")
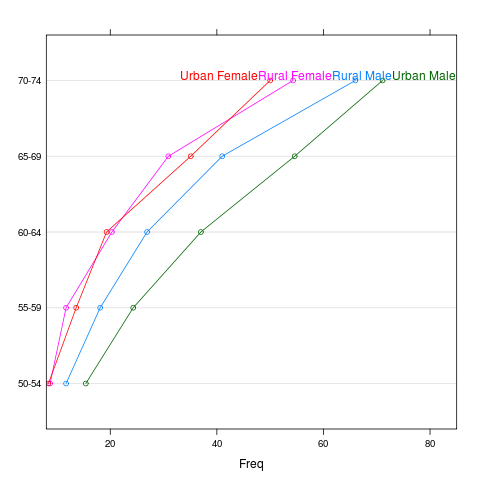
Label points at the top, making sure they don't collide.
direct.label(p,"top.qp")
library(lattice)
p <- dotplot(VADeaths,xlim=c(8,85),type="o")
|
Useful for labeling lines that all end at the top. direct.label(p,"angled.endpoints") |
|
Label points at the top, making sure they don't collide. direct.label(p,"top.qp") |
| Please contact Toby Dylan Hocking if you are using directlabels or have ideas to contribute, thanks! |
| Documentation website generated from source code version 2021.2.24 (git revision bb6db07 Mon, 14 Jun 2021 22:38:45 +0530) using inlinedocs. |
| validate |