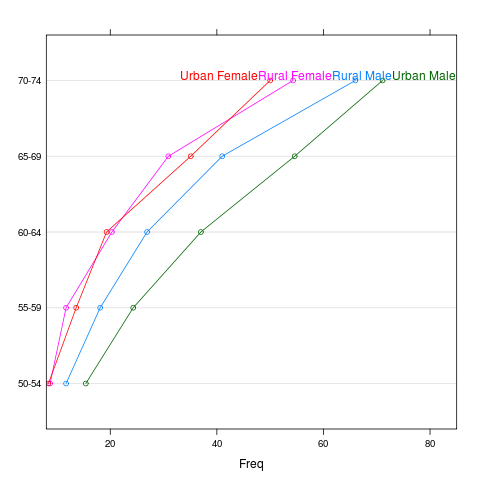
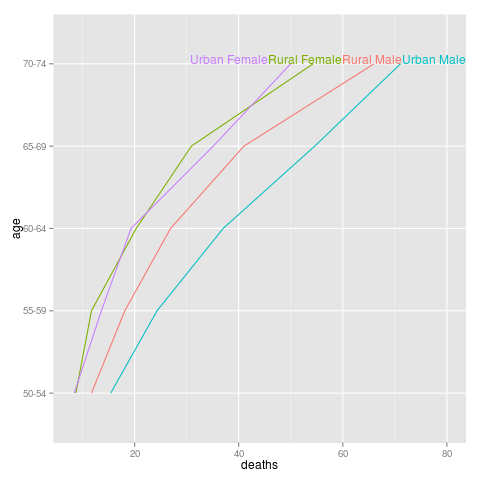
Label points at the top, making sure they don't collide.
top.qp <- list("top.points","calc.boxes", qp.labels("x","left","right", make.tiebreaker("y","x"), xlimits))
library(lattice) p <- dotplot(VADeaths,xlim=c(8,85),type="o") direct.label(p,"top.qp") |
|
vad <- as.data.frame.table(VADeaths) names(vad) <- c("age","demographic","deaths") library(ggplot2) p <- qplot(deaths,age,data=vad,group=demographic,geom="line",colour=demographic)+ xlim(8,80) direct.label(p,"top.qp") |
Please contact Toby Dylan Hocking if you are using directlabels or have ideas to contribute, thanks! |
Documentation website generated from source code version 2021.2.24 (git revision bb6db07 Mon, 14 Jun 2021 22:38:45 +0530) using inlinedocs. |
validate |