New code for various kinds of cross-validation
The goal of this blog post is to explore machine learning in the context of relatively small data, which may not be large enough (relative to the strength of the signal) to learn the pattern. In that case, we may wish to combine our small data set with another data set, to see if the learning algorithm works better. For example, in a collaboration with Bruce Hungate and Jeff Propster of NAU ECOSS, we have several qSIP data sets (quantitative Stable Isotope Probing), from different experiments/sites/etc, and we would like to know if we can combine them, and learn a more accurate model, than if we learned separate models for each subset. Here we explore what kinds of data could result in better learning, when we combine data sets.
This blog post explains how to use the new
mlr3resampling::ResamplingSameOtherSizes code to achieve the same
results as a previous
post
which used mlr3resampling::ResamplingVariableSizeTrain and
mlr3resampling::ResamplingSameOther.
Simulation
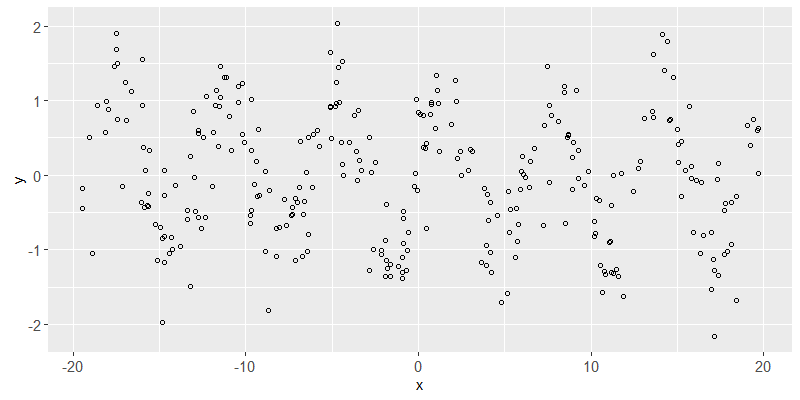
Below we simulate data with one feature and output/label with a sin pattern.
N <- 300
abs.x <- 20
set.seed(1)
x.vec <- runif(N, -abs.x, abs.x)
str(x.vec)
## num [1:300] -9.38 -5.12 2.91 16.33 -11.93 ...
library(data.table)
(task.dt <- data.table(
  x=x.vec,
  y = sin(x.vec)+rnorm(N,sd=0.5)))
##               x           y
##           <num>       <num>
##   1:  -9.379653  0.17998438
##   2:  -5.115044  0.91074391
##   3:   2.914135  0.06646766
##   4:  16.328312 -1.04599970
##   5: -11.932723 -0.15164176
##  ---
## 296:   7.257701 -0.67659452
## 297: -16.033236 -0.36348886
## 298: -15.243898 -0.65963855
## 299: -17.982414  0.88088493
## 300:  17.170157 -2.16547007
reg.task <- mlr3::TaskRegr$new(
  "sin", task.dt, target="y"
)
library(animint2)
ggplot()+
  geom_point(aes(
    x, y),
    shape=1,
    data=task.dt)

Above we see a scatterplot of the simulated data. The goal of the learning algorithm will be to predict y from x.
Visualizing test error as a function of train set size
In the code below, we define a K-fold cross-validation experiment, with
- K=2
folds, - a
ratioof 0.9 between the train set sizes, - and 19
sizesof train sets smaller than the full size.
reg_size_cv <- mlr3resampling::ResamplingSameOtherSizesCV$new()
reg_size_cv$param_set$values$folds <- 2
reg_size_cv$param_set$values$ratio <- 0.9
reg_size_cv$param_set$values$sizes <- 19
reg_size_cv$param_set$values$seeds <- 3
reg_size_cv$instantiate(reg.task)
reg_size_cv$instance$iteration.dt
##      test.subset train.subsets groups test.fold                  test
##           <char>        <char>  <int>     <int>                <list>
##   1:        full          same    150         1  5, 8, 9,12,15,17,...
##   2:        full          same    150         1  5, 8, 9,12,15,17,...
##   3:        full          same    150         1  5, 8, 9,12,15,17,...
##   4:        full          same    150         1  5, 8, 9,12,15,17,...
##   5:        full          same    150         1  5, 8, 9,12,15,17,...
##  ---
## 116:        full          same    150         2       1,2,3,4,6,7,...
## 117:        full          same    150         2       1,2,3,4,6,7,...
## 118:        full          same    150         2       1,2,3,4,6,7,...
## 119:        full          same    150         2       1,2,3,4,6,7,...
## 120:        full          same    150         2       1,2,3,4,6,7,...
##                      train  seed n.train.groups iteration
##                     <list> <int>          <int>     <int>
##   1:  6,13,20,39,58,75,...     1             20         1
##   2:  6,13,20,39,58,63,...     1             22         2
##   3:  6,13,20,39,58,63,...     1             25         3
##   4:  6,13,20,39,58,63,...     1             27         4
##   5:  6,13,20,23,39,58,...     1             30         5
##  ---
## 116:  5, 9,12,15,19,26,...     3             98       116
## 117:  5, 8, 9,12,15,19,...     3            109       117
## 118:  5, 8, 9,12,15,19,...     3            121       118
## 119:  5, 8, 9,12,15,19,...     3            135       119
## 120:  5, 8, 9,12,15,17,...     3            150       120
The table above shows that there is a CV iteration/split to compute for each train set size (20 to 150), random seeds (1 to 3), and cross-validation fold (1 or 2).
(reg.learner.list <- list(
  if(requireNamespace("rpart"))mlr3::LearnerRegrRpart$new(),
  mlr3::LearnerRegrFeatureless$new()))
## [[1]]
## <LearnerRegrRpart:regr.rpart>: Regression Tree
## * Model: -
## * Parameters: xval=0
## * Packages: mlr3, rpart
## * Predict Types:  [response]
## * Feature Types: logical, integer, numeric, factor, ordered
## * Properties: importance, missings, selected_features, weights
##
## [[2]]
## <LearnerRegrFeatureless:regr.featureless>: Featureless Regression Learner
## * Model: -
## * Parameters: robust=FALSE
## * Packages: mlr3, stats
## * Predict Types:  [response], se
## * Feature Types: logical, integer, numeric, character, factor, ordered,
##   POSIXct
## * Properties: featureless, importance, missings, selected_features
(reg.bench.grid <- mlr3::benchmark_grid(
  reg.task,
  reg.learner.list,
  reg_size_cv))
##      task          learner          resampling
##    <char>           <char>              <char>
## 1:    sin       regr.rpart same_other_sizes_cv
## 2:    sin regr.featureless same_other_sizes_cv
if(require(future))plan("multisession")
lgr::get_logger("mlr3")$set_threshold("warn")
(reg.bench.result <- mlr3::benchmark(
  reg.bench.grid, store_models = TRUE))
## <BenchmarkResult> of 240 rows with 2 resampling runs
##  nr task_id       learner_id       resampling_id iters warnings errors
##   1     sin       regr.rpart same_other_sizes_cv   120        0      0
##   2     sin regr.featureless same_other_sizes_cv   120        0      0
reg.bench.score <- mlr3resampling::score(reg.bench.result)
reg.bench.score[1]
##    test.subset train.subsets groups test.fold                  test
##         <char>        <char>  <int>     <int>                <list>
## 1:        full          same    150         1  5, 8, 9,12,15,17,...
##                    train  seed n.train.groups iteration
##                   <list> <int>          <int>     <int>
## 1:  6,13,20,39,58,75,...     1             20         1
##                                   uhash    nr           task task_id
##                                  <char> <int>         <list>  <char>
## 1: d07cff7b-d5f8-4b12-8330-90014f7712de     1 <TaskRegr:sin>     sin
##                          learner learner_id                   resampling
##                           <list>     <char>                       <list>
## 1: <LearnerRegrRpart:regr.rpart> regr.rpart <ResamplingSameOtherSizesCV>
##          resampling_id       prediction  regr.mse algorithm
##                 <char>           <list>     <num>    <char>
## 1: same_other_sizes_cv <PredictionRegr> 0.7558423     rpart
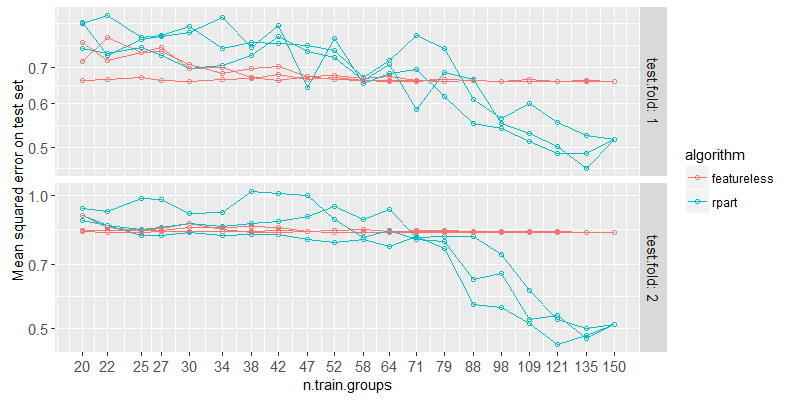
The output above includes one row of the resulting scores. The plot below shows test error for several train sizes.
(train_size_vec <- unique(reg.bench.score$n.train.groups))
##  [1]  20  22  25  27  30  34  38  42  47  52  58  64  71  79  88  98 109 121 135
## [20] 150
ggplot()+
  scale_x_log10(
    breaks=train_size_vec)+
  scale_y_log10(
    "Mean squared error on test set")+
  geom_line(aes(
    n.train.groups, regr.mse,
    subset=paste(algorithm, seed),
    color=algorithm),
    shape=1,
    data=reg.bench.score)+
  geom_point(aes(
    n.train.groups, regr.mse, color=algorithm),
    shape=1,
    data=reg.bench.score)+
  facet_grid(
    test.fold~.,
    labeller=label_both,
    scales="free")

Above we plot the test error for each fold and train set size. We can see that if there are less than about 80 samples, the rpart learning algorithm has about the same error as featureless (representing the error rate of no relationship learned between input/output). So if we have subsets of data that really are the same, but each is smaller than this critical threshold for this problem, then rpart will not be able to learn anything unless we put the subsets together. Let’s try it!
Simulating and combining identical subsets
The code below assigns three test subsets to the randomly simulated data.
task.dt[, random_subset := rep(1:3, l=.N)][]
##               x           y random_subset
##           <num>       <num>         <int>
##   1:  -9.379653  0.17998438             1
##   2:  -5.115044  0.91074391             2
##   3:   2.914135  0.06646766             3
##   4:  16.328312 -1.04599970             1
##   5: -11.932723 -0.15164176             2
##  ---
## 296:   7.257701 -0.67659452             2
## 297: -16.033236 -0.36348886             3
## 298: -15.243898 -0.65963855             1
## 299: -17.982414  0.88088493             2
## 300:  17.170157 -2.16547007             3
table(subset.tab <- task.dt$random_subset)
##
##   1   2   3
## 100 100 100
The output above shows that there are an equal number (1) of each subset. Below we define a task using that subset,
subset.task <- mlr3::TaskRegr$new(
  "sin", task.dt, target="y")
subset.task$col_roles$stratum <- "random_subset"
subset.task$col_roles$subset <- "random_subset"
subset.task$col_roles$feature <- "x"
str(subset.task$col_roles)
## List of 8
##  $ feature: chr "x"
##  $ target : chr "y"
##  $ name   : chr(0)
##  $ order  : chr(0)
##  $ stratum: chr "random_subset"
##  $ group  : chr(0)
##  $ weight : chr(0)
##  $ subset : chr "random_subset"
Below we define cross-validation using two folds, as above.
same_other_cv <- mlr3resampling::ResamplingSameOtherSizesCV$new()
same_other_cv$param_set$values$folds <- 2
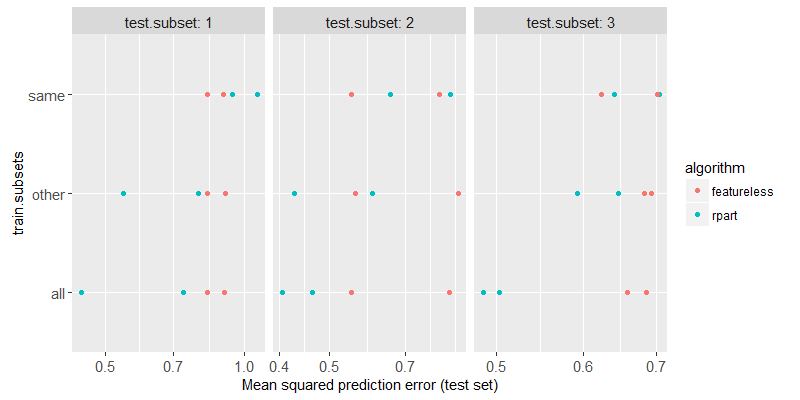
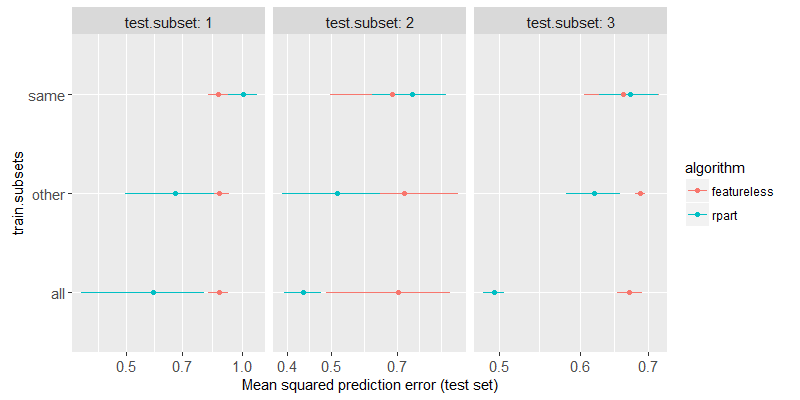
So using the 2-fold cross-validation, half of the data in each subset will be assigned to train, and the other half to test. So each “same” train set will have only 50 samples (for the same subset), each “other” train set will have 100 samples, and each “all” train set will have 150 samples. In the previous section, we saw that rpart needs at least 100 samples to learn, so we should expect that “same” is just as inaccurate as featureless, “other” is a bit better, and “all” is better still. We compute and plot the results using the code below,
(same.other.grid <- mlr3::benchmark_grid(
  subset.task,
  reg.learner.list,
  same_other_cv))
##      task          learner          resampling
##    <char>           <char>              <char>
## 1:    sin       regr.rpart same_other_sizes_cv
## 2:    sin regr.featureless same_other_sizes_cv
(same.other.result <- mlr3::benchmark(
  same.other.grid, store_models = TRUE))
## <BenchmarkResult> of 36 rows with 2 resampling runs
##  nr task_id       learner_id       resampling_id iters warnings errors
##   1     sin       regr.rpart same_other_sizes_cv    18        0      0
##   2     sin regr.featureless same_other_sizes_cv    18        0      0
same.other.score <- mlr3resampling::score(same.other.result)
same.other.score[1]
##    test.subset train.subsets groups test.fold                  test
##          <int>        <char>  <int>     <int>                <list>
## 1:           1           all    150         1  4, 7,25,34,37,49,...
##              train  seed n.train.groups iteration
##             <list> <int>          <int>     <int>
## 1: 1,2,5,6,8,9,...     1            150         1
##                                   uhash    nr           task task_id
##                                  <char> <int>         <list>  <char>
## 1: a3137ab3-93c9-4702-8393-9a714589ad08     1 <TaskRegr:sin>     sin
##                          learner learner_id                   resampling
##                           <list>     <char>                       <list>
## 1: <LearnerRegrRpart:regr.rpart> regr.rpart <ResamplingSameOtherSizesCV>
##          resampling_id       prediction  regr.mse algorithm
##                 <char>           <list>     <num>    <char>
## 1: same_other_sizes_cv <PredictionRegr> 0.7350953     rpart
ggplot()+
  geom_point(aes(
    regr.mse, train.subsets, color=algorithm),
    data=same.other.score)+
  facet_grid(. ~ test.subset, labeller=label_both, scales="free")+
  scale_x_log10(
    "Mean squared prediction error (test set)")

same.other.wide <- dcast(
  same.other.score,
  test.subset + train.subsets + algorithm ~ .,
  list(mean,sd),
  value.var="regr.mse")
ggplot()+
  geom_segment(aes(
    regr.mse_mean+regr.mse_sd, train.subsets,
    xend=regr.mse_mean-regr.mse_sd, yend=train.subsets,
    color=algorithm),
    data=same.other.wide)+
  geom_point(aes(
    regr.mse_mean, train.subsets, color=algorithm),
    data=same.other.wide)+
  facet_grid(. ~ test.subset, labeller=label_both, scales="free")+
  scale_x_log10(
    "Mean squared prediction error (test set)")

The figure above shows a test subset in each panel, the train subsets on the y axis, the test error on the x axis, the two different algorithms are shown in two different colors. We can clearly see that
- For
train.subsets=same, rpart has about the same test error as featureless, which indicates that nothing has been learned (not enough data). - For
train.subsets=other, rpart test error is significantly smaller than featureless, indicating that some non-trivial relationship between inputs and outputs has been learned. - For
train.subsets=all, rpart test error is smaller still, which indicates that combining all of the subsets is beneficial in this case (when the pattern is exactly the same in the different subsets).
Conclusions
We have shown how to use mlr3resampling to determine the number of
train samples which is required to get non-trivial prediction
accuracy. In the simulation above, that number was about 100 train
samples. We then defined subsets and cross-validation such that there
were only 50 train samples per subset, so training on just samples from
the same subset is not enough (at least for the rpart learning
algorithm). We observed smaller test error rates when training on
other/all subsets (larger train sets, all with the same
distribution). Overall this is a convincing demonstration that it is
possible for “other” and “all” to be more accurate than “same” — for
the case where the subsets really do have an identical pattern. If in
real data we see the opposite (same is the best), then this implies
that there is a different pattern to learn in each subset.
Session info
sessionInfo()
## R Under development (unstable) (2024-01-23 r85822 ucrt)
## Platform: x86_64-w64-mingw32/x64
## Running under: Windows 10 x64 (build 19045)
##
## Matrix products: default
##
##
## locale:
## [1] LC_COLLATE=English_United States.utf8
## [2] LC_CTYPE=English_United States.utf8
## [3] LC_MONETARY=English_United States.utf8
## [4] LC_NUMERIC=C
## [5] LC_TIME=English_United States.utf8
##
## time zone: America/Phoenix
## tzcode source: internal
##
## attached base packages:
## [1] stats     graphics  grDevices utils     datasets  methods   base
##
## other attached packages:
## [1] future_1.33.2      animint2_2024.1.24 data.table_1.15.99
##
## loaded via a namespace (and not attached):
##  [1] gtable_0.3.4             future.apply_1.11.2      compiler_4.4.0
##  [4] BiocManager_1.30.22      highr_0.10               crayon_1.5.2
##  [7] rpart_4.1.23             Rcpp_1.0.12              stringr_1.5.1
## [10] parallel_4.4.0           globals_0.16.3           scales_1.3.0
## [13] uuid_1.2-0               RhpcBLASctl_0.23-42      R6_2.5.1
## [16] plyr_1.8.9               labeling_0.4.3           knitr_1.46
## [19] palmerpenguins_0.1.1     backports_1.4.1          checkmate_2.3.1
## [22] munsell_0.5.1            paradox_0.11.1           mlr3measures_0.5.0
## [25] rlang_1.1.3              stringi_1.8.3            lgr_0.4.4
## [28] xfun_0.43                mlr3_0.18.0              mlr3misc_0.15.0
## [31] RJSONIO_1.3-1.9          cli_3.6.2                magrittr_2.0.3
## [34] digest_0.6.34            grid_4.4.0               lifecycle_1.0.4
## [37] evaluate_0.23            glue_1.7.0               farver_2.1.1
## [40] listenv_0.9.1            codetools_0.2-19         parallelly_1.37.1
## [43] colorspace_2.1-0         reshape2_1.4.4           tools_4.4.0
## [46] mlr3resampling_2024.4.14
UPDATE 15 Apr 2024
Code above uses the new version 2024.4.15 of mlr3resampling, in which
we now use subset instead of group, for consistency with the usage
of group in other mlr3 packages. See:
- ResamplingSameOtherSizesCV vignette for more info.
- old blog post for a discussion about how to do the analyses above using the old classes (not recommended).