data.table asymptotic timings
The purpose of this vignette is to make figures which show the efficiency of data.table.
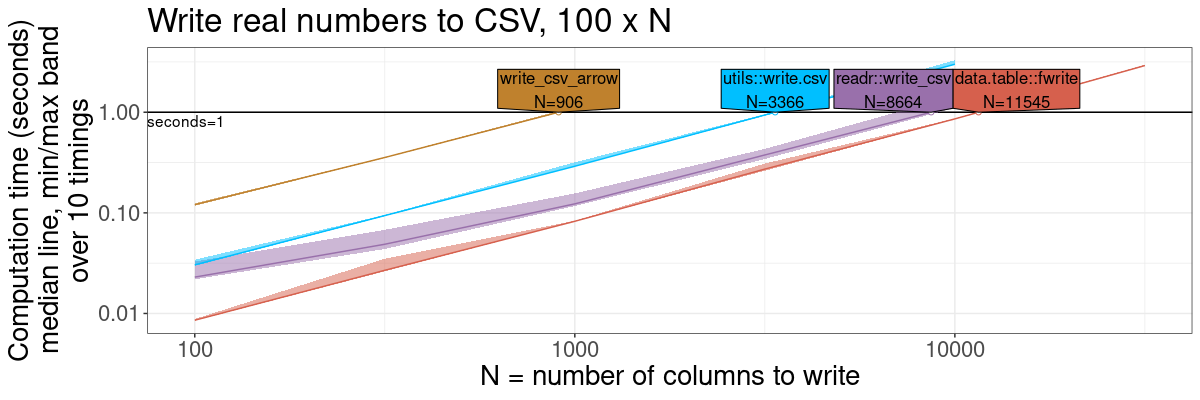
fwrite: fast CSV writer
library(data.table)
library(readr)
library(arrow)
library(ggplot2)
write.colors <- c(
  "readr::write_csv"="#9970AB",
  "data.table::fwrite"="#D6604D",
  "write_csv_arrow"="#BF812D",
  "utils::write.csv"="deepskyblue")
n.rows <- 100
seconds.limit <- 1

atime.write.vary.cols <- atime::atime(
  N=as.integer(10^seq(2, 6, by=0.5)),
  setup={
    set.seed(1)
    input.vec <- rnorm(n.rows*N)
    input.mat <- matrix(input.vec, n.rows, N)
    input.df <- data.frame(input.mat)
  },
  seconds.limit = seconds.limit,
  "data.table::fwrite"={
    data.table::fwrite(input.df, tempfile(), showProgress = FALSE)
  },
  "write_csv_arrow"={
    arrow::write_csv_arrow(input.df, tempfile())
  },
  "readr::write_csv"={
    readr::write_csv(input.df, tempfile(), progress = FALSE)
  },
  "utils::write.csv"=utils::write.csv(input.df, tempfile()))
## Warning: Some expressions had a GC in every iteration; so filtering is disabled.
refs.write.vary.cols <- atime::references_best(atime.write.vary.cols)
pred.write.vary.cols <- predict(refs.write.vary.cols)

gg.write <- plot(pred.write.vary.cols)+
  theme(text=element_text(size=20))+
  ggtitle(sprintf("Write real numbers to CSV, %d x N", n.rows))+
  scale_x_log10("N = number of columns to write")+
  scale_y_log10("Computation time (seconds)
median line, min/max band
over 10 timings")+
  facet_null()+
  scale_fill_manual(values=write.colors)+
  scale_color_manual(values=write.colors)
## Scale for x is already present.
## Adding another scale for x, which will replace the existing scale.
## Scale for y is already present.
## Adding another scale for y, which will replace the existing scale.
gg.write
## Warning: Transformation introduced infinite values in continuous x-axis
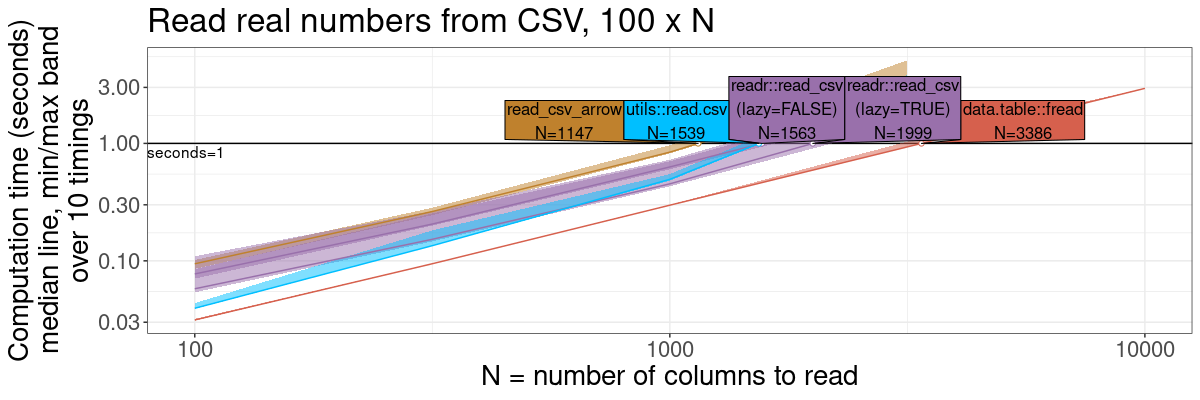
fread: fast CSV reader
read.colors <- c(
  "readr::read_csv\n(lazy=TRUE)"="#9970AB",
  "readr::read_csv\n(lazy=FALSE)"="#9970AB",
  "data.table::fread"="#D6604D",
  "read_csv_arrow"="#BF812D",
  "utils::read.csv"="deepskyblue")
atime.read.vary.cols <- atime::atime(
  N=as.integer(10^seq(2, 6, by=0.5)),
  setup={
    set.seed(1)
    input.vec <- rnorm(n.rows*N)
    input.mat <- matrix(input.vec, n.rows, N)
    input.df <- data.frame(input.mat)
    input.csv <- tempfile()
    fwrite(input.df, input.csv)
  },
  seconds.limit = seconds.limit,
  "data.table::fread"={
    data.table::fread(input.csv, showProgress = FALSE)
  },
  "read_csv_arrow"={
    arrow::read_csv_arrow(input.csv)
  },
  "readr::read_csv\n(lazy=TRUE)"={
    readr::read_csv(input.csv, progress = FALSE, show_col_types = FALSE, lazy=TRUE)
  },
  "readr::read_csv\n(lazy=FALSE)"={
    readr::read_csv(input.csv, progress = FALSE, show_col_types = FALSE, lazy=FALSE)
  },
  "utils::read.csv"=utils::read.csv(input.csv))
## Warning: Some expressions had a GC in every iteration; so filtering is disabled.
refs.read.vary.cols <- atime::references_best(atime.read.vary.cols)
pred.read.vary.cols <- predict(refs.read.vary.cols)

gg.read <- plot(pred.read.vary.cols)+
  theme(text=element_text(size=20))+
  ggtitle(sprintf("Read real numbers from CSV, %d x N", n.rows))+
  scale_x_log10("N = number of columns to read")+
  scale_y_log10("Computation time (seconds)
median line, min/max band
over 10 timings")+
  facet_null()+
  scale_fill_manual(values=read.colors)+
  scale_color_manual(values=read.colors)
## Scale for x is already present.
## Adding another scale for x, which will replace the existing scale.
## Scale for y is already present.
## Adding another scale for y, which will replace the existing scale.
gg.read
## Warning: Transformation introduced infinite values in continuous x-axis
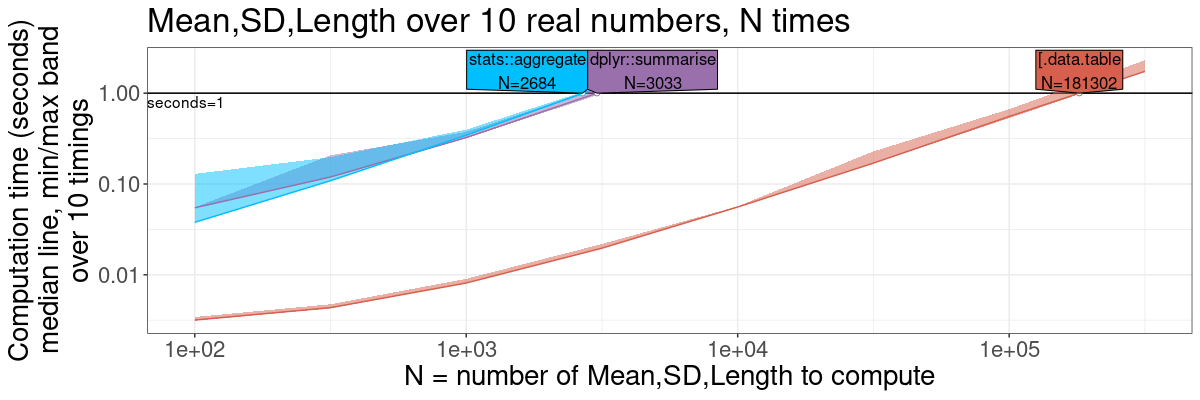
Summarize by group
ml.colors <- c(
  "dplyr::summarise"="#9970AB",
  "[.data.table"="#D6604D",
  "stats::aggregate"="deepskyblue")
options(dplyr.summarise.inform=FALSE)
n.folds <- 10
ml.atime <- atime::atime(
  N=as.integer(10^seq(2, 7, by=0.5)),
  setup={
    loss.dt <- data.table(
      name="loss",
      fold=rep(1:n.folds, each=2*N),
      loss=rnorm(2*N*n.folds),
      set=rep(c("subtrain","validation"),each=N),
      epoch=1:N,
      key=c("set","epoch","fold"))
  },
  seconds.limit=seconds.limit,
  "[.data.table"={
    loss.dt[, .(
      loss_length=.N,
      loss_mean=mean(loss),
      loss_sd=sd(loss)
    ), by=.(set, epoch)]
  },
  "stats::aggregate"={
    res <- stats::aggregate(
      loss ~ set + epoch,
      loss.dt,
      function(values)list(c(
        loss_length=length(values),
        loss_mean=mean(values),
        loss_sd=sd(values))))
    data.frame(
      subset(res, select=-loss),
      do.call(rbind, res$loss))
  },
  "dplyr::summarise"={
    loss.dt |>
      dplyr::group_by(set, epoch) |>
      dplyr::summarise(
        loss_length=length(loss),
        loss_mean=mean(loss),
        loss_sd=sd(loss))
  })
## Warning: Some expressions had a GC in every iteration; so filtering is disabled.
ml.refs <- atime::references_best(ml.atime)
ml.pred <- predict(ml.refs)
ml.gg <- plot(ml.pred)+
  theme(text=element_text(size=20))+
  ggtitle(sprintf("Mean,SD,Length over %d real numbers, N times", n.folds))+
  scale_x_log10("N = number of Mean,SD,Length to compute")+
  scale_y_log10("Computation time (seconds)
median line, min/max band
over 10 timings")+
  facet_null()+
  scale_fill_manual(values=ml.colors)+
  scale_color_manual(values=ml.colors)
## Scale for x is already present.
## Adding another scale for x, which will replace the existing scale.
## Scale for y is already present.
## Adding another scale for y, which will replace the existing scale.
ml.gg
## Warning: Transformation introduced infinite values in continuous x-axis
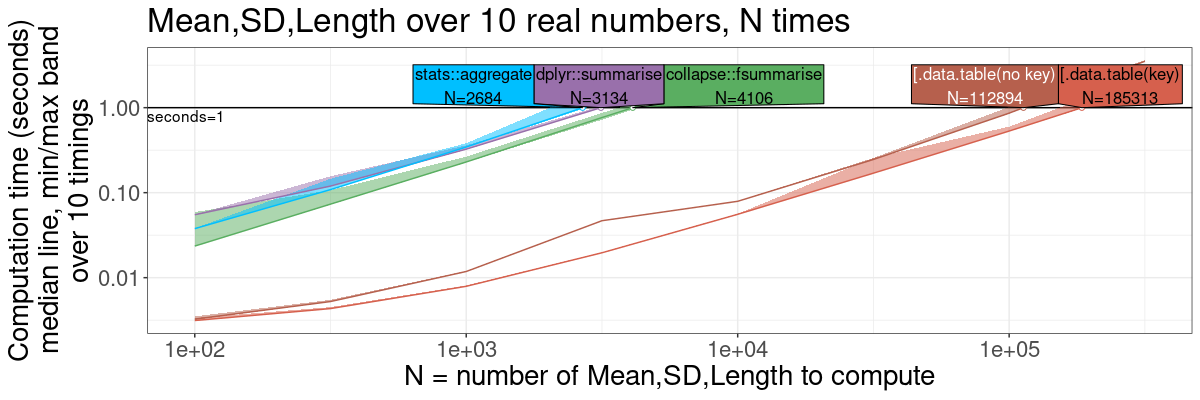
Summarize by group, expanded
The previous section is simpler to explain, whereas this section is
more comprehensive/fair, because it shows versions of data.table
with and without key. Both versions are much faster than the
competitors, though.
options(dplyr.summarise.inform=FALSE)
n.folds <- 10
ml.exp.atime <- atime::atime(
  N=as.integer(10^seq(2, 7, by=0.5)),
  setup={
    loss.dt <- data.table(
      name="loss",
      fold=rep(1:n.folds, each=2*N),
      loss=rnorm(2*N*n.folds),
      set=rep(c("subtrain","validation"),each=N),
      epoch=1:N)
    key.dt <- data.table(loss.dt, key=c("set","epoch","fold"))
  },
  seconds.limit=seconds.limit,
  "[.data.table(no key)"={
    loss.dt[, .(
      loss_length=.N,
      loss_mean=mean(loss),
      loss_sd=sd(loss)
    ), by=.(set, epoch)]
  },
  "[.data.table(key)"={
    key.dt[, .(
      loss_length=.N,
      loss_mean=mean(loss),
      loss_sd=sd(loss)
    ), by=.(set, epoch)]
  },
  "stats::aggregate"={
    res <- stats::aggregate(
      loss ~ set + epoch,
      loss.dt,
      function(values)list(c(
        loss_length=length(values),
        loss_mean=mean(values),
        loss_sd=sd(values))))
    data.frame(
      subset(res, select=-loss),
      do.call(rbind, res$loss))
  },
  "dplyr::summarise"={
    loss.dt |>
      dplyr::group_by(set, epoch) |>
      dplyr::summarise(
        loss_length=length(loss),
        loss_mean=mean(loss),
        loss_sd=sd(loss))
  },
  "collapse::fsummarise"={
    loss.dt |>
      collapse::fgroup_by(set, epoch) |>
      collapse::fsummarise(
        loss_length=length(loss),
        loss_mean=mean(loss),
        loss_sd=sd(loss))
  })
## Warning: Some expressions had a GC in every iteration; so filtering is disabled.

## Warning: Some expressions had a GC in every iteration; so filtering is disabled.

## Warning: Some expressions had a GC in every iteration; so filtering is disabled.
ml.exp.refs <- atime::references_best(ml.exp.atime)
ml.exp.pred <- predict(ml.exp.refs)
ml.exp.colors <- c(
  "collapse::fsummarise"="#5AAE61",
  "dplyr::summarise"="#9970AB",
  "[.data.table(key)"="#D6604D",
  "[.data.table(no key)"="#B6604D",
  "stats::aggregate"="deepskyblue")
ml.exp.gg <- plot(ml.exp.pred)+
  theme(text=element_text(size=20))+
  ggtitle(sprintf("Mean,SD,Length over %d real numbers, N times", n.folds))+
  scale_x_log10("N = number of Mean,SD,Length to compute")+
  scale_y_log10("Computation time (seconds)
median line, min/max band
over 10 timings")+
  facet_null()+
  scale_fill_manual(values=ml.exp.colors)+
  scale_color_manual(values=ml.exp.colors)
## Scale for x is already present.
## Adding another scale for x, which will replace the existing scale.
## Scale for y is already present.
## Adding another scale for y, which will replace the existing scale.
ml.exp.gg
## Warning: Transformation introduced infinite values in continuous x-axis
version info
sessionInfo()
## R version 4.3.1 (2023-06-16)
## Platform: x86_64-pc-linux-gnu (64-bit)
## Running under: Ubuntu 22.04.3 LTS
##
## Matrix products: default
## BLAS:   /usr/lib/x86_64-linux-gnu/blas/libblas.so.3.10.0
## LAPACK: /usr/lib/x86_64-linux-gnu/lapack/liblapack.so.3.10.0
##
## locale:
##  [1] LC_CTYPE=fr_FR.UTF-8       LC_NUMERIC=C               LC_TIME=fr_FR.UTF-8
##  [4] LC_COLLATE=fr_FR.UTF-8     LC_MONETARY=fr_FR.UTF-8    LC_MESSAGES=fr_FR.UTF-8
##  [7] LC_PAPER=fr_FR.UTF-8       LC_NAME=C                  LC_ADDRESS=C
## [10] LC_TELEPHONE=C             LC_MEASUREMENT=fr_FR.UTF-8 LC_IDENTIFICATION=C
##
## time zone: America/Phoenix
## tzcode source: system (glibc)
##
## attached base packages:
## [1] stats     graphics  utils     datasets  grDevices methods   base
##
## other attached packages:
## [1] ggplot2_3.4.3     arrow_13.0.0      readr_2.1.4       data.table_1.14.8
##
## loaded via a namespace (and not attached):
##  [1] bit_4.0.5              gtable_0.3.4           highr_0.10             dplyr_1.1.2
##  [5] compiler_4.3.1         crayon_1.5.2           Rcpp_1.0.11            tidyselect_1.2.0
##  [9] collapse_1.9.6         parallel_4.3.1         assertthat_0.2.1       scales_1.2.1
## [13] directlabels_2023.8.25 lattice_0.21-8         R6_2.5.1               generics_0.1.3
## [17] knitr_1.43             tibble_3.2.1           munsell_0.5.0          atime_2023.10.9
## [21] pillar_1.9.0           tzdb_0.3.0             rlang_1.1.1            utf8_1.2.3
## [25] xfun_0.40              quadprog_1.5-8         bit64_4.0.5            cli_3.6.1
## [29] withr_2.5.0            magrittr_2.0.3         grid_4.3.1             vroom_1.6.3
## [33] hms_1.1.3              lifecycle_1.0.3        vctrs_0.6.3            bench_1.1.3
## [37] evaluate_0.21          glue_1.6.2             farver_2.1.1           profmem_0.6.0
## [41] fansi_1.0.4            colorspace_2.1-0       purrr_1.0.2            tools_4.3.1
## [45] pkgconfig_2.0.3