Comparing asymptotic timings of CSV read/write functions
Recently I submitted a project proposal to the NSF POSE program, about expanding the open-source ecosystem around the R data.table package. Part of the project involves developing new performance testing tools, that allow developers to see if their PRs cause any differences in time/memory usage. To implement this part of the project, I have created the atime R package for asymptotic performance testing, which means measuring and plotting time/memory usage as a function of data size.
Regular expressions in base R
This kind of analysis is useful for empirically determining the
asymptotic complexity class (linear, quadratic, etc) of a given
function. For example, the R function gregexpr() implements regular
expression matching, and was quadratic time until I submitted a linear
time patch in 2019. You can see the difference on the log-log
plot (time
vs data size); quadratic time functions appear as lines with larger
slopes, in the R-3.5.2 panel. So asymptotic complexity testing can be
useful for identifying parts of the code which may have sub-optimal
implementation in terms of performance, and could be improved.
Reading and Writing CSV
The data.table package provides fread() and fwrite() functions,
which implement reading/writing CSV data files. I used atime to
compare the asymptotic complexity of these functions, with their
analogs in base R and tidyverse. The code I used is in the
compare-data.table-tidyverse.Rmd
vignette, which was rendered on a NAU monsoon compute node (up to 64
cores/threads), and my personal MacBook Pro laptop (up to 2
cores/threads), both running R-4.2.3 (more reproducibility details
below).
Reading CSV, variable number of rows
We begin with an example comparison where there is not much difference between the various methods. Below we plot the memory (top) and computation time (bottom) for reading CSV files with N rows, where N is on the X/horizontal axis, and the different methods are shown in different colors (darker shades of red/purple/green mean more threads).
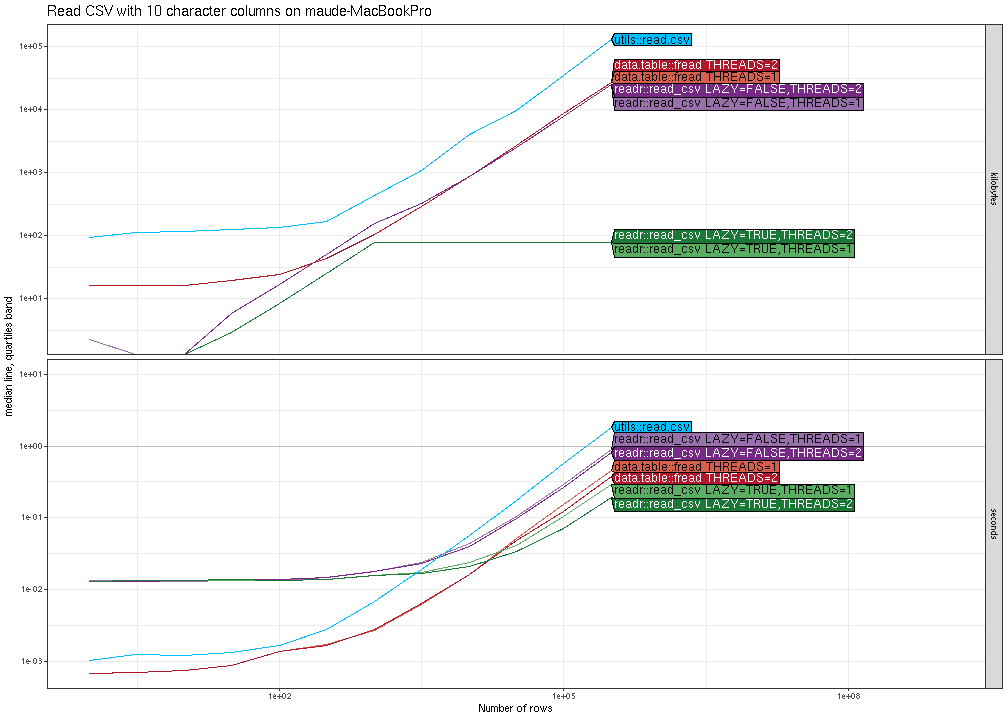
The results above show that in terms of time, all methods are
asymptotically equivalent (same slope). It is clear that
data.table::fread is fastest for small number of rows, and
readr::read_csv is slightly faster (by constant factors) for larger
number of rows. It is also clear that it is faster (by constant
factors) to use two threads instead of one. In terms of memory usage,
readr::read_csv has a clear advantage in this comparison (constant
versus linear asymptotic memory usage for the others), because it does
not actually read all of the data into memory, until it is actually
used in R for computation. The plot above was from my laptop, and the
plot below is the same comparison, run on a compute node of the NAU
Monsoon cluster.
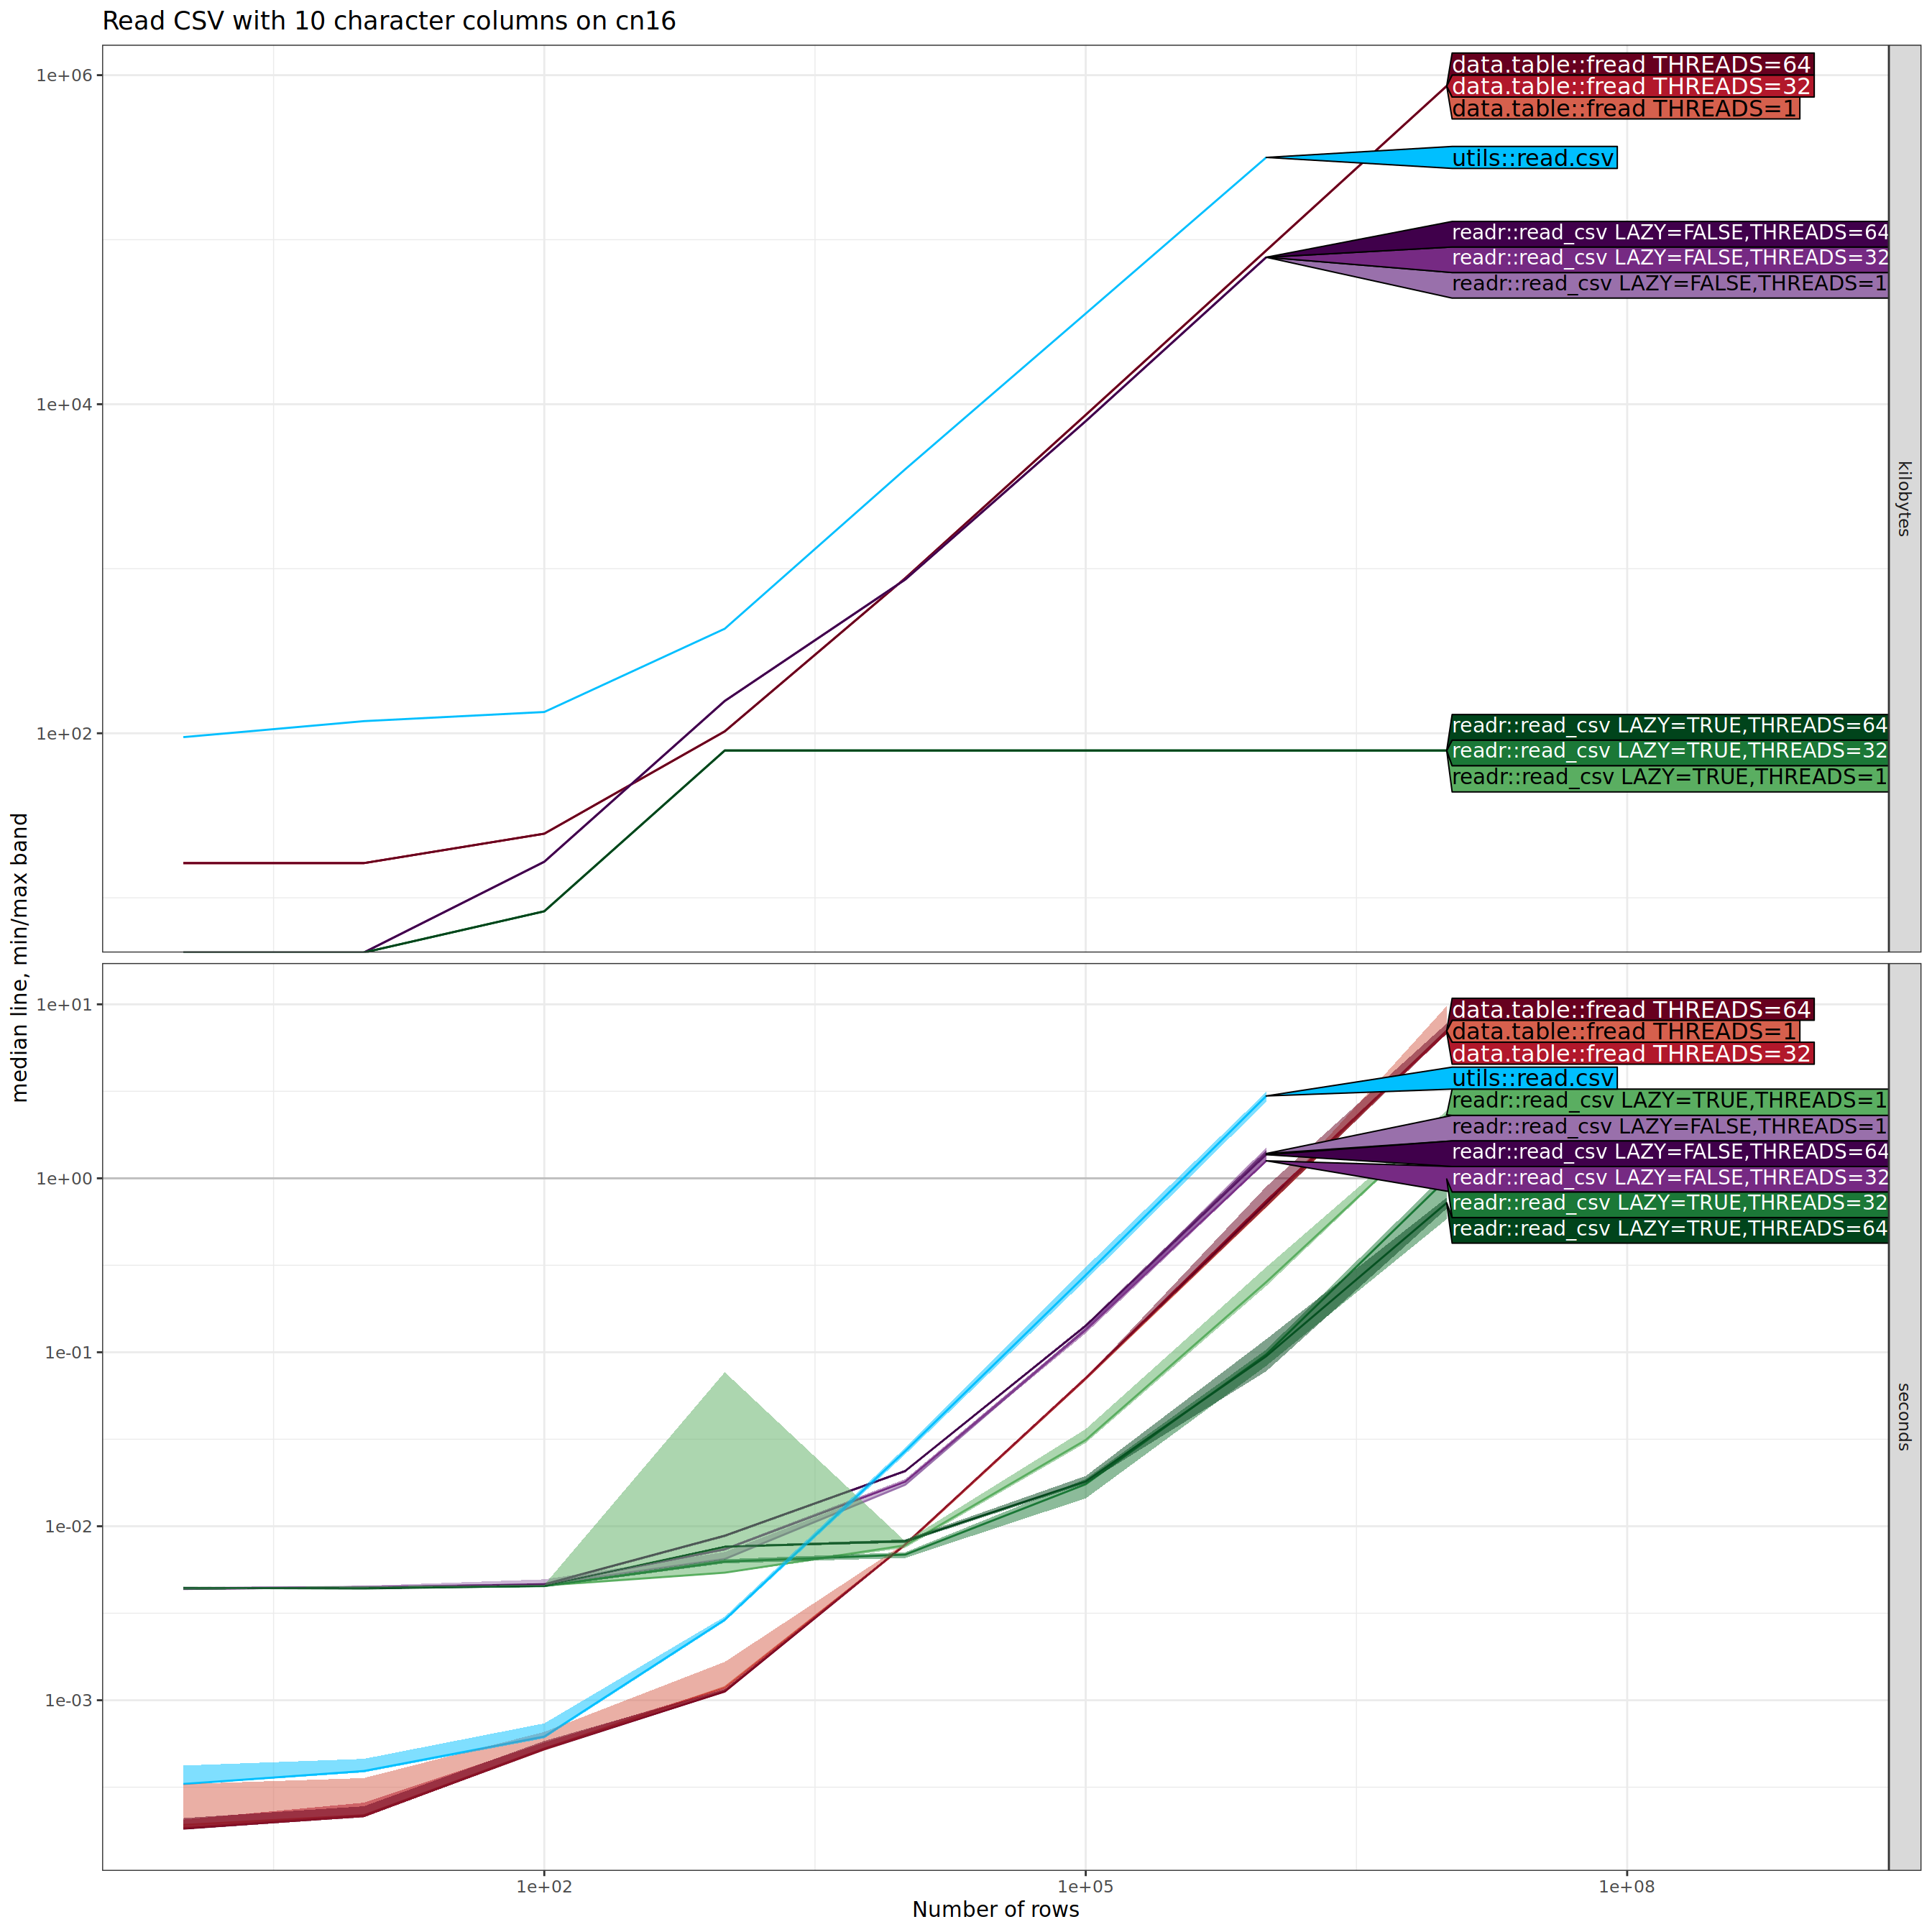
The plot above shows essentially the same results as the previous one,
except that there are three different values for number of threads (1,
32, 64). For data.table::fread and for
readr::read_csv(lazy=FALSE), the number of threads does not make
much difference. For readr::read_csv(lazy=TRUE), there are speedups
when reading larger number of rows with larger number of
threads. Below we do another comparison, where we collapse each row
after reading it into memory.
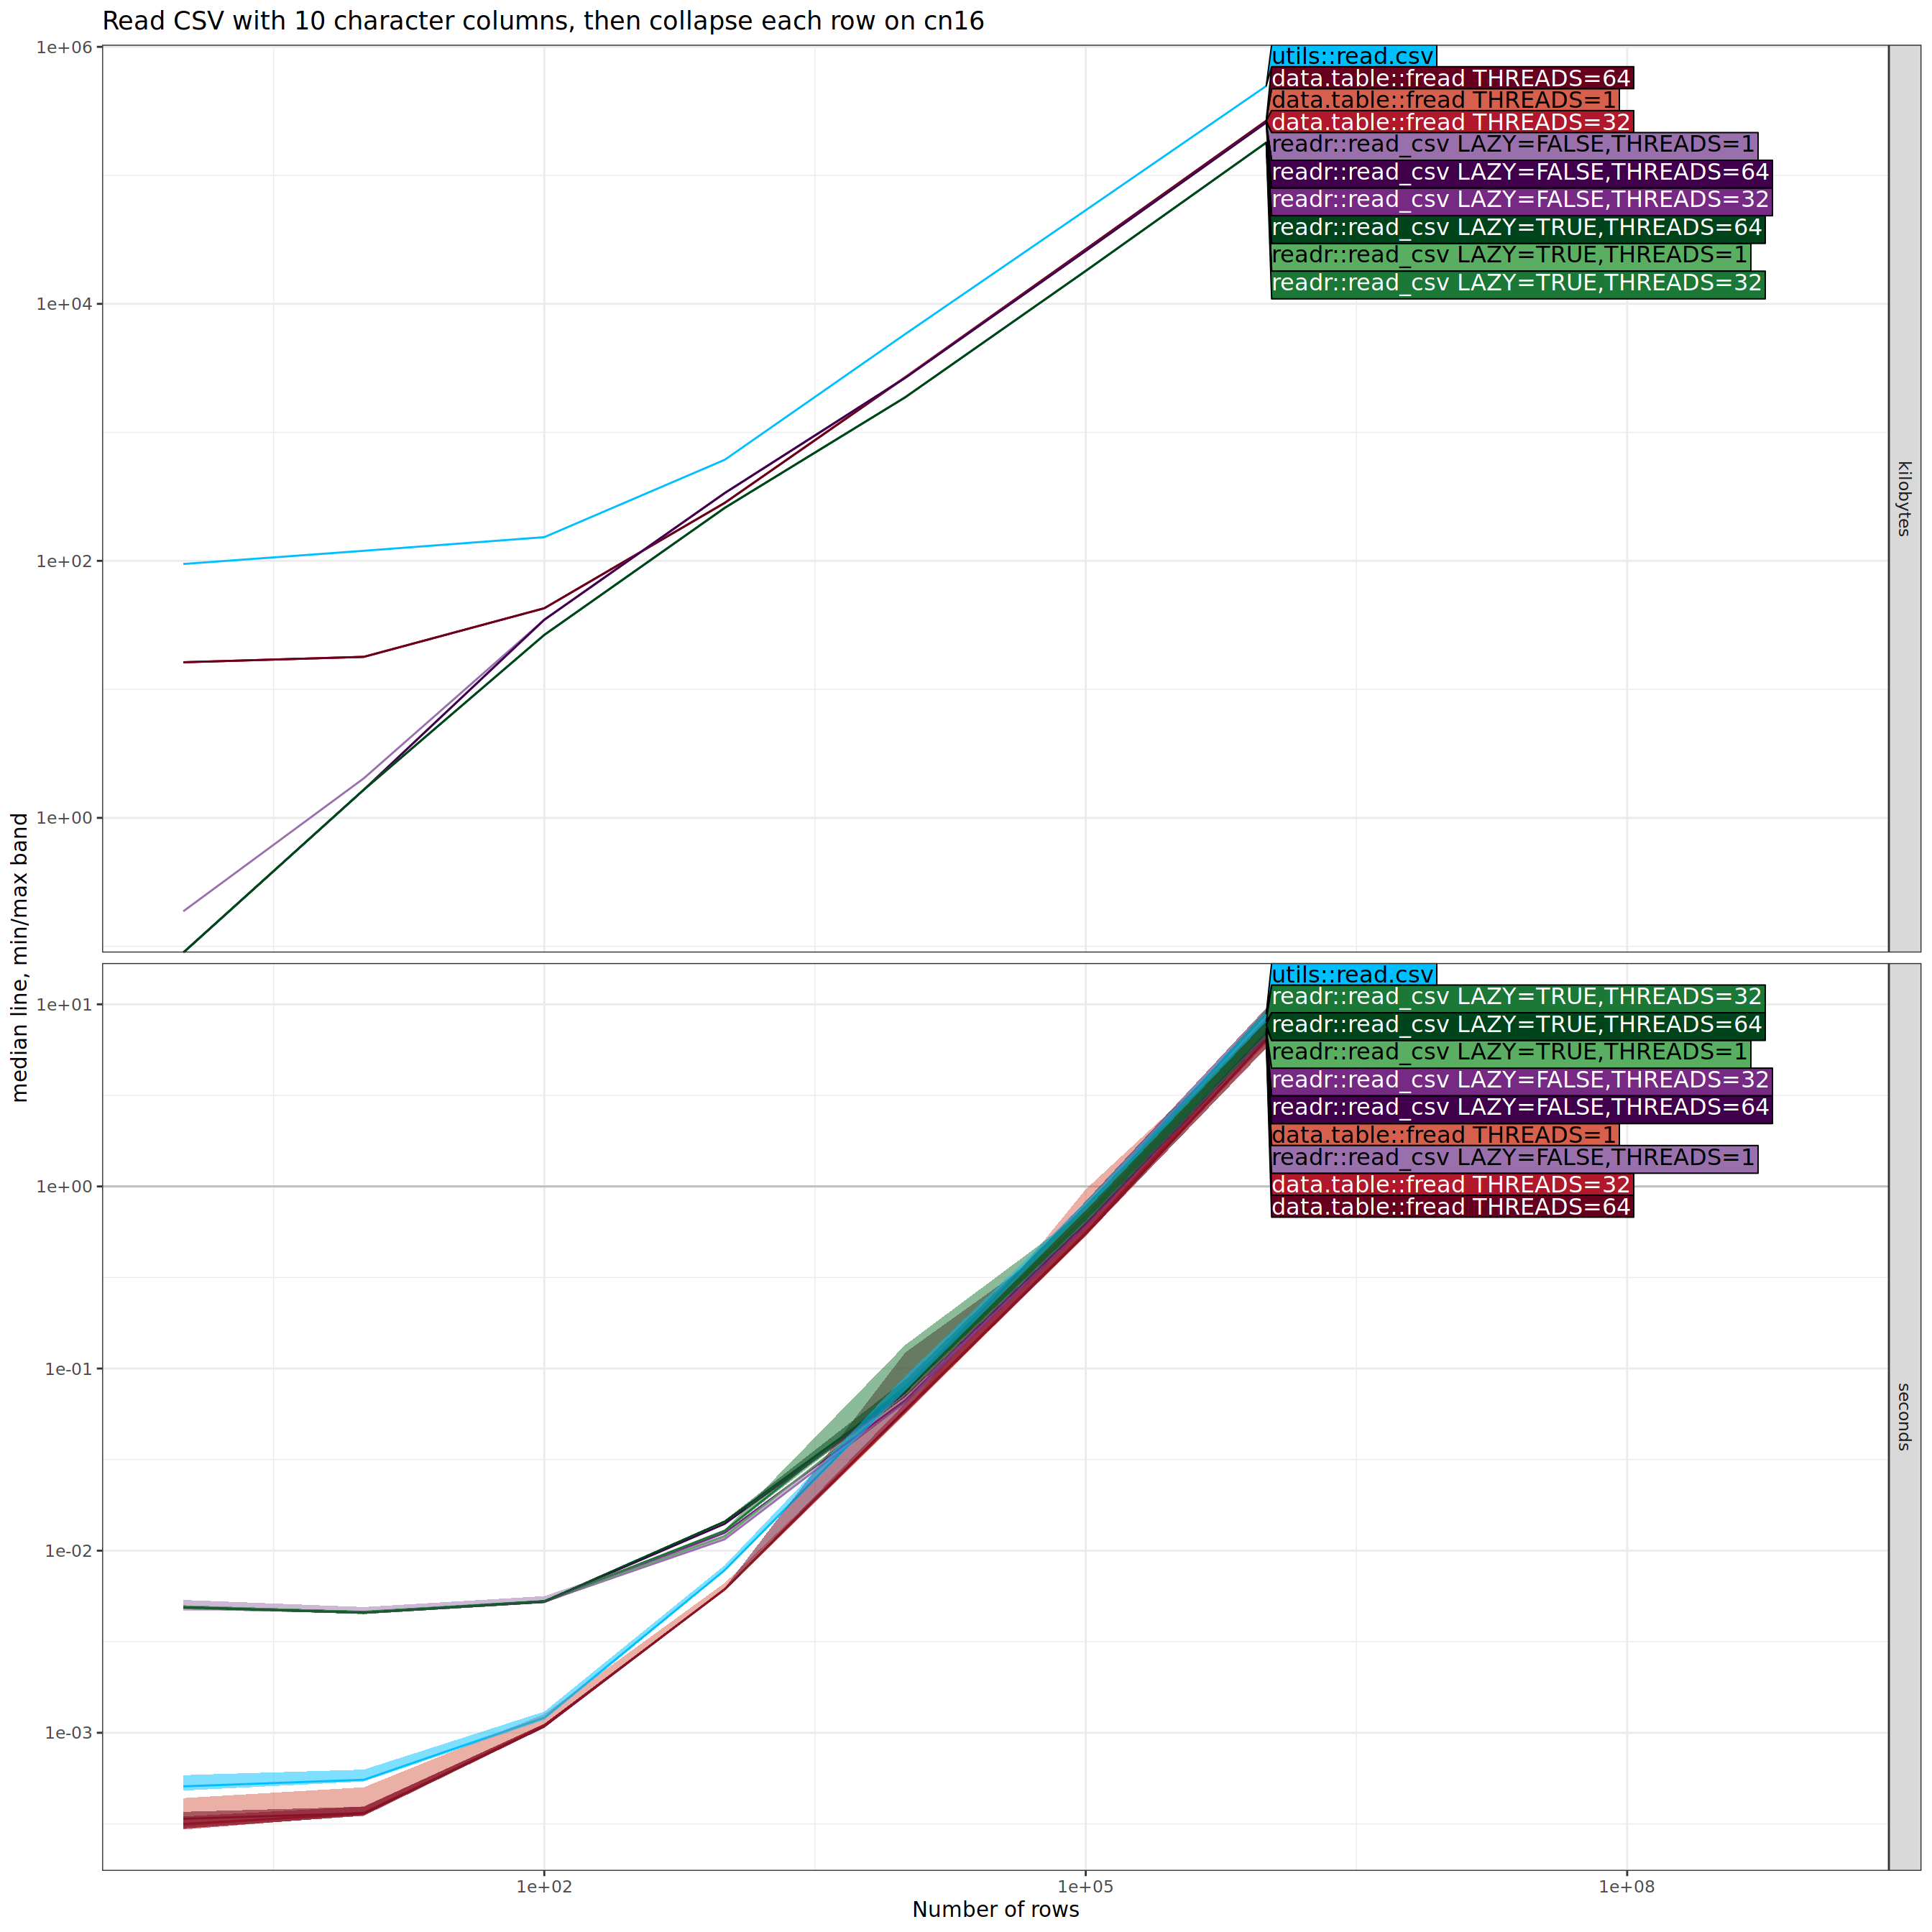
The plot above shows little difference between the methods. In particular, the asymptotic difference in memory usage has disappeared, indicating there is no advantage to lazy data loading, if all of the data are actually used in the downstream R code computations.
Reading CSV, variable number of columns
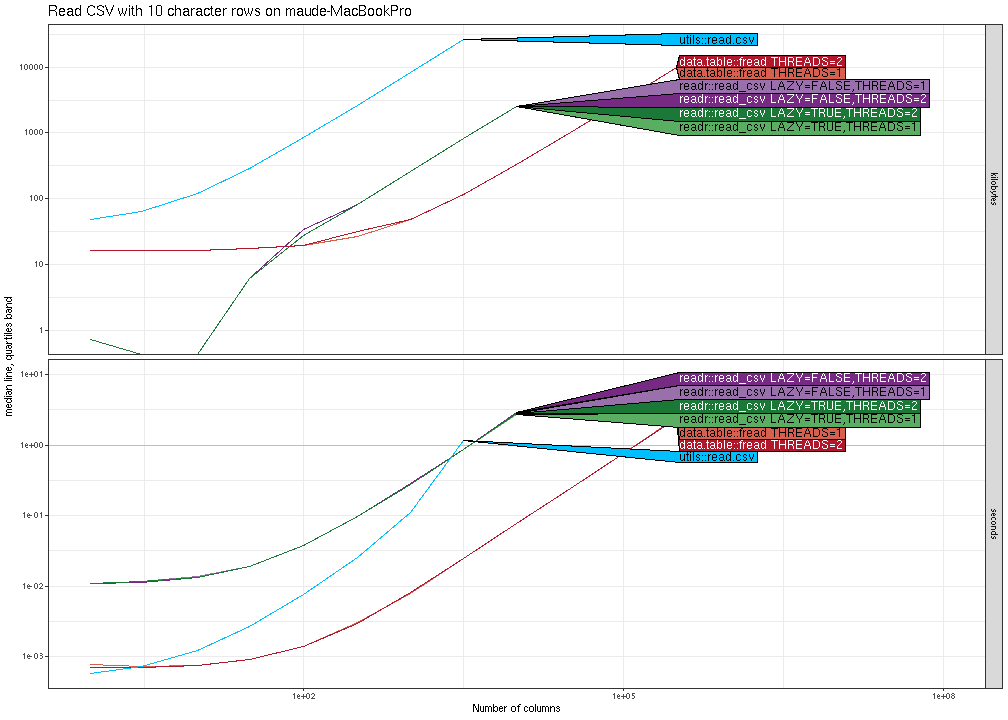
In the comparison below, the data size that we vary on the X/horizontal axis is the number of columns (whereas in the previous section it was the number of rows).
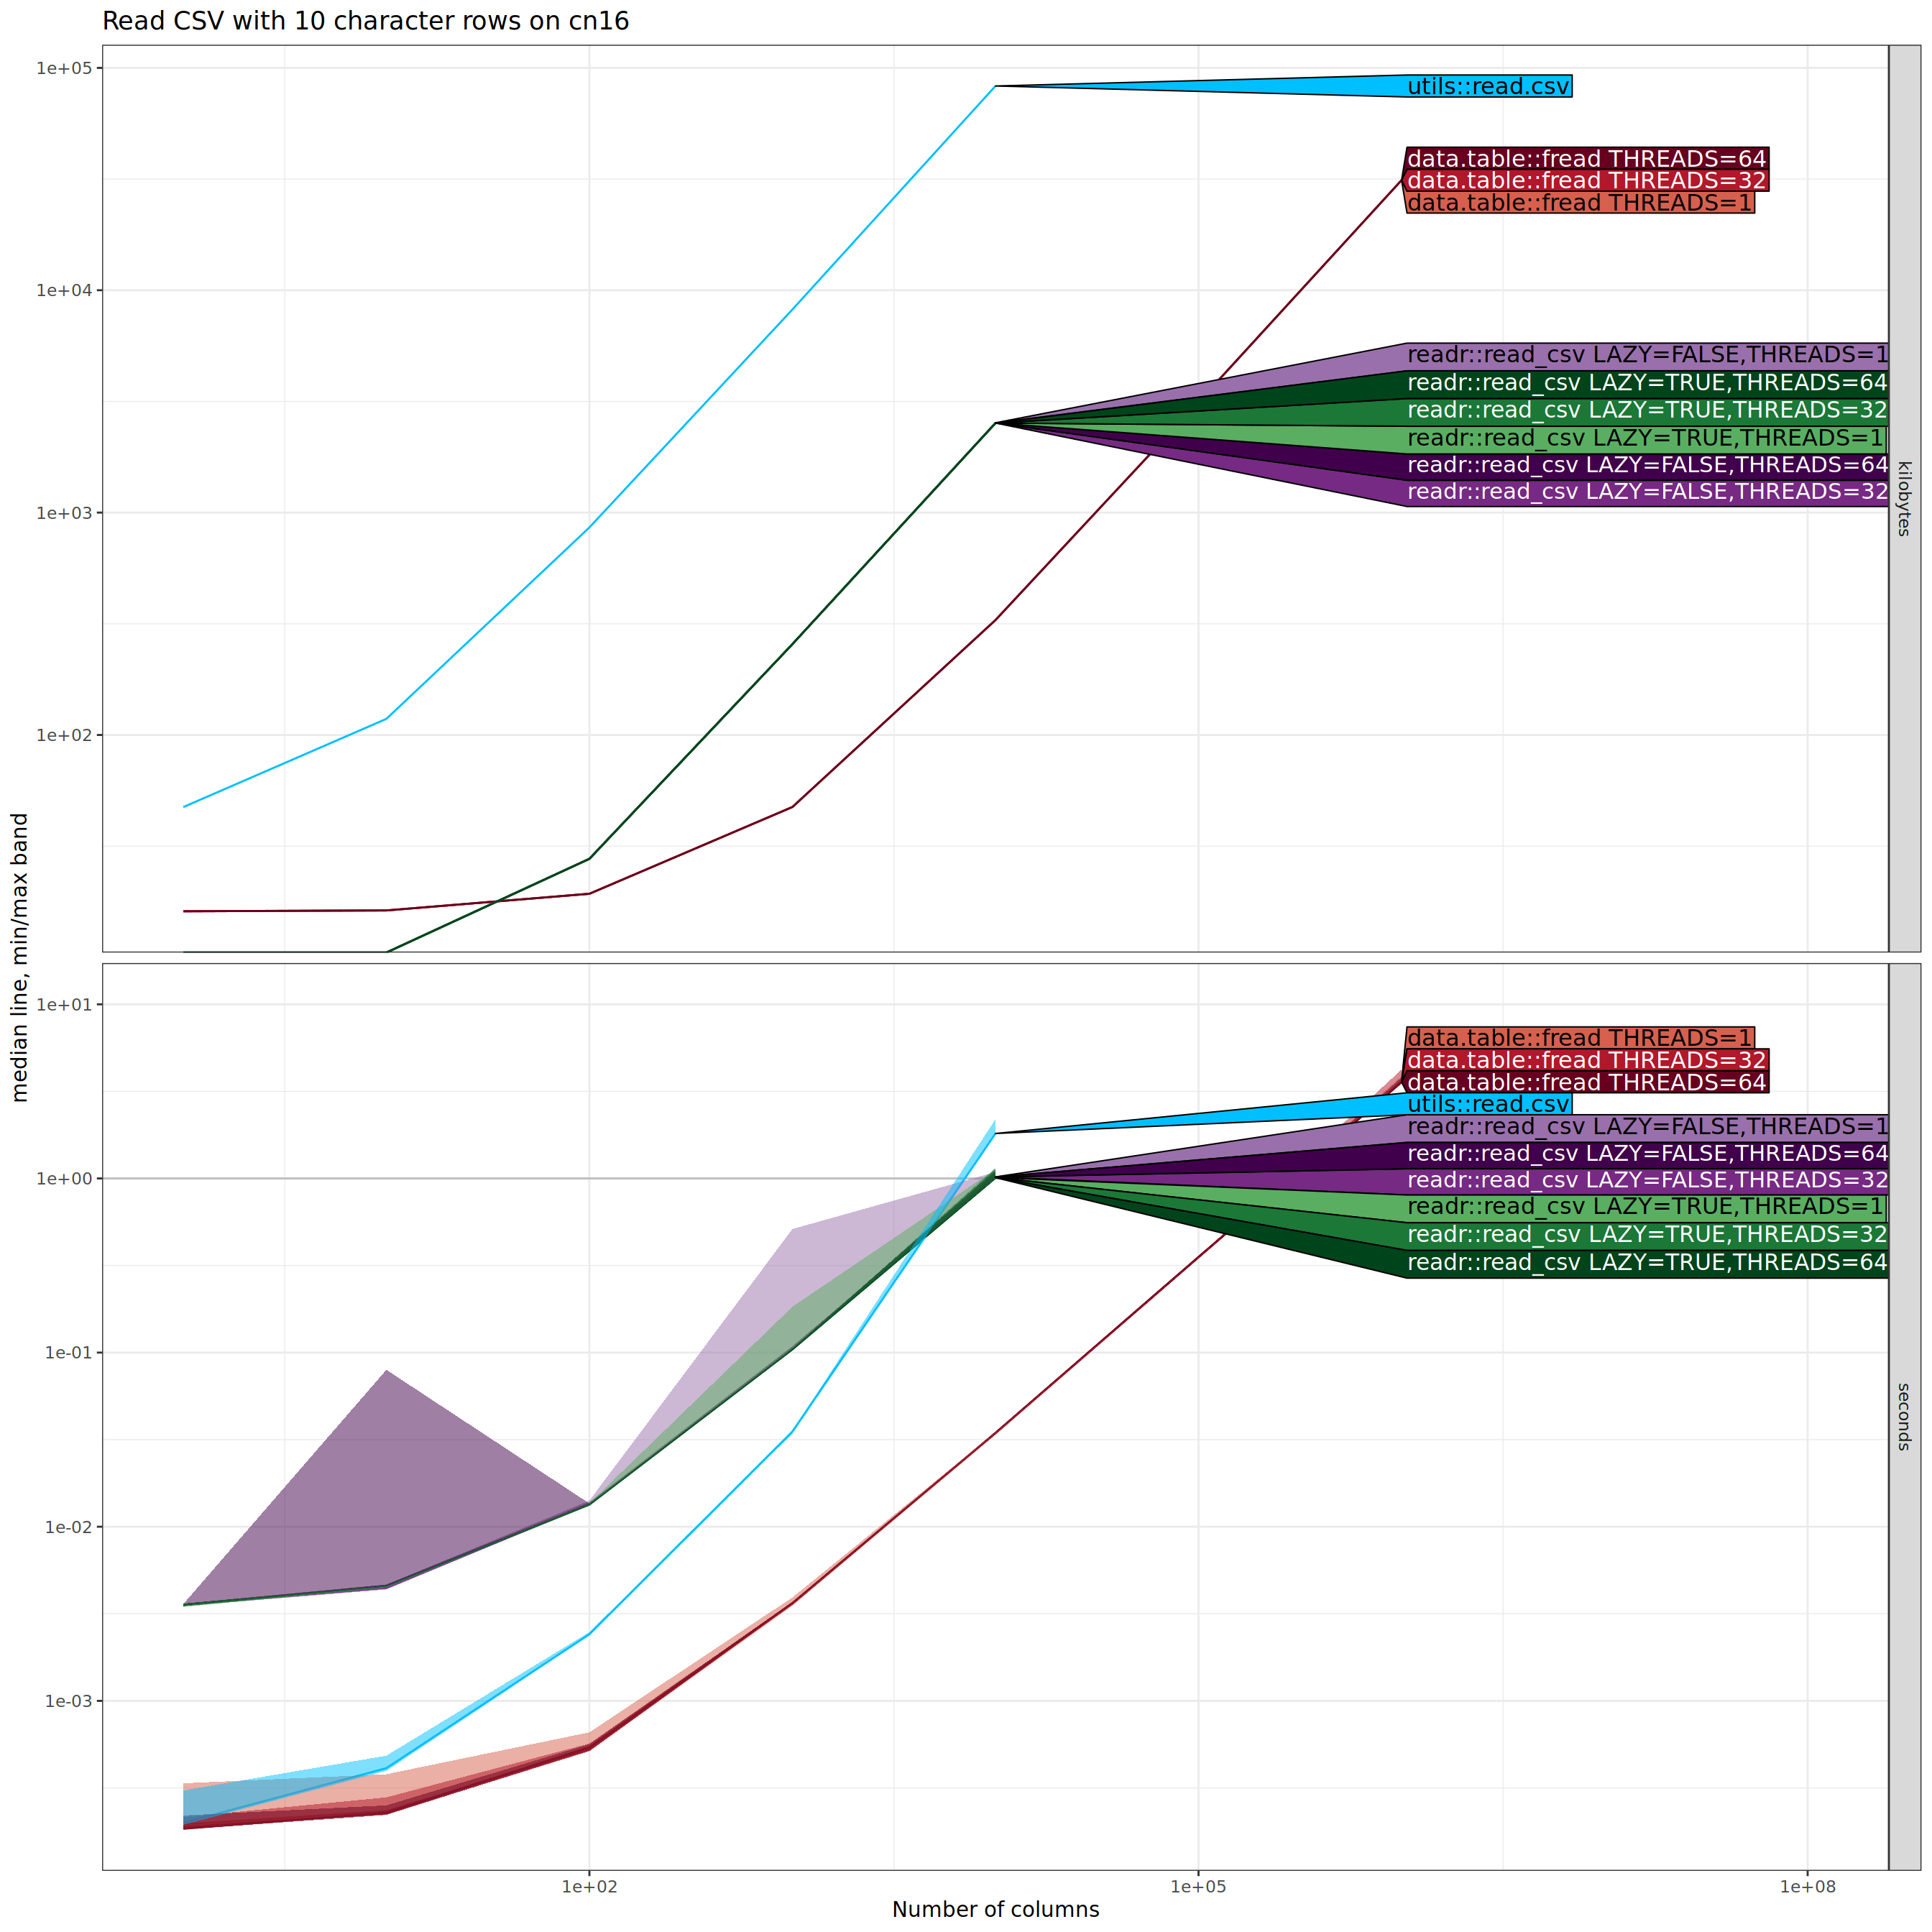
The plot above shows that both time and memory for most methods is
linear, except time is super-linear for utils::read.csv(). There is
no advantage to using multiple threads. The plot above was for the NAU
Monsoon compute node, and these trends are also observable when run on my
laptop, as shown in the figure below.
Write CSV, variable number of columns
Below we show results for writing CSV files (previous sections above were about reading rather than writing), with different numbers of character columns (displayed on X/horizontal axis).
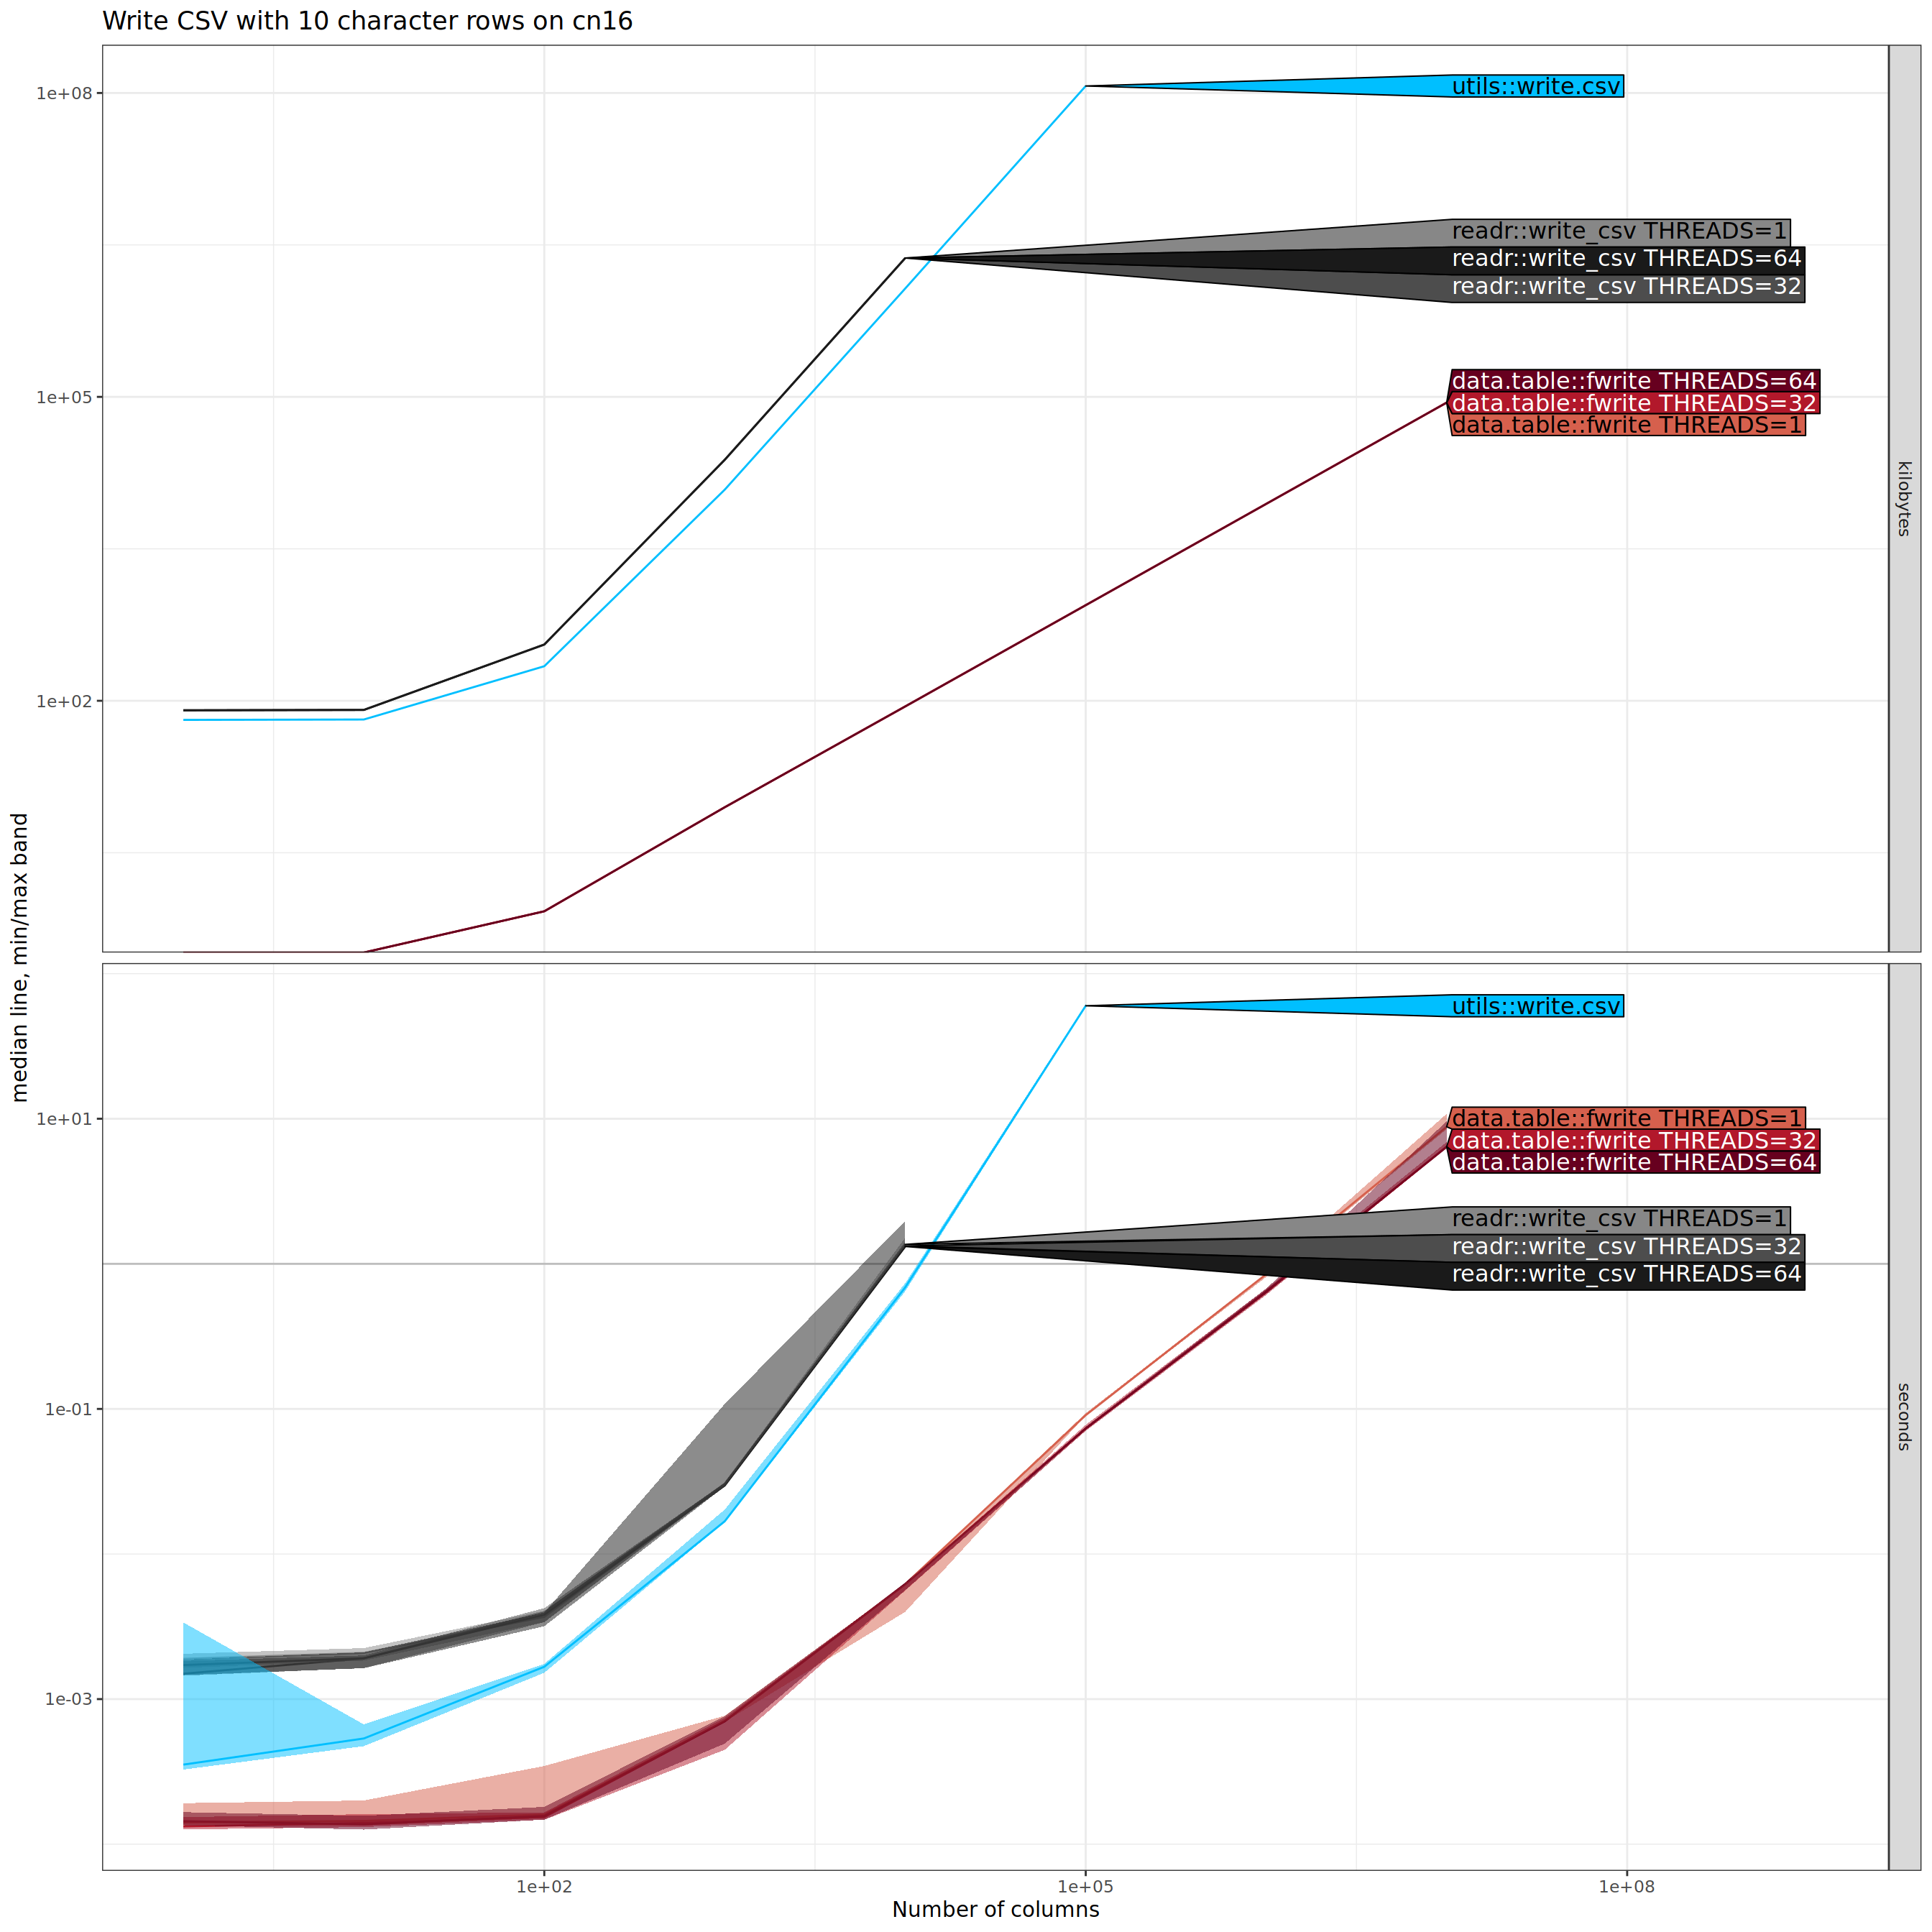
There is an interesting trend in the plot above:
data.table::fwrite() is asymptotically more efficient (smaller
slope) than both other methods. To more clearly see the asymptotic
complexity class of each method, we can add reference lines, as shown
below.
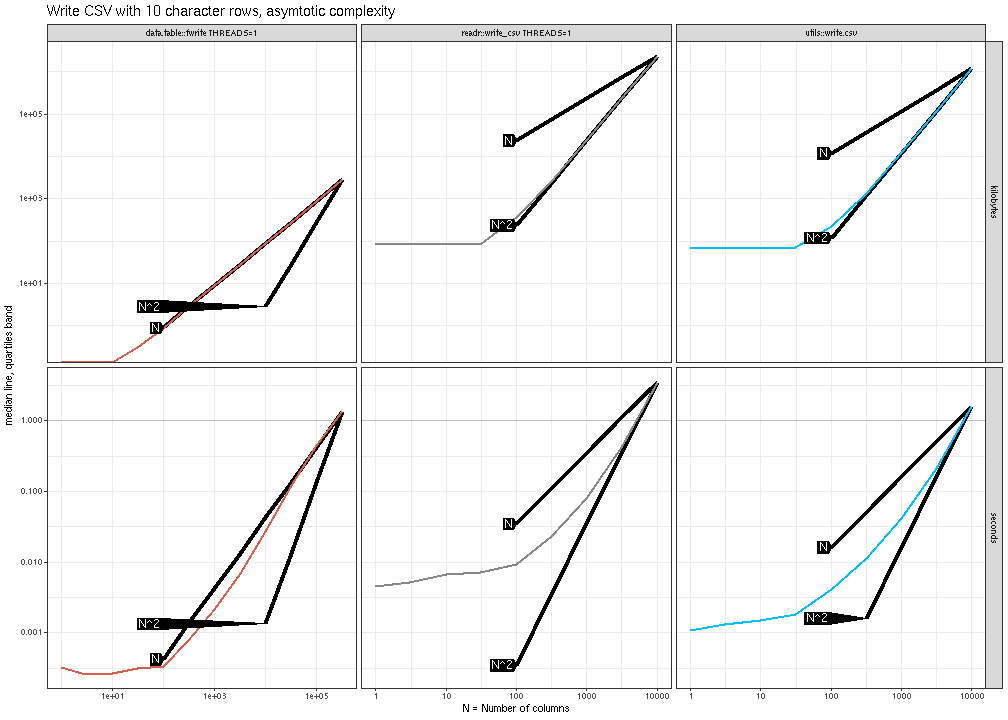
The plot above shows that data.table::fwrite() is linear (N) in
the number of columns, whereas the other methods are quadratic
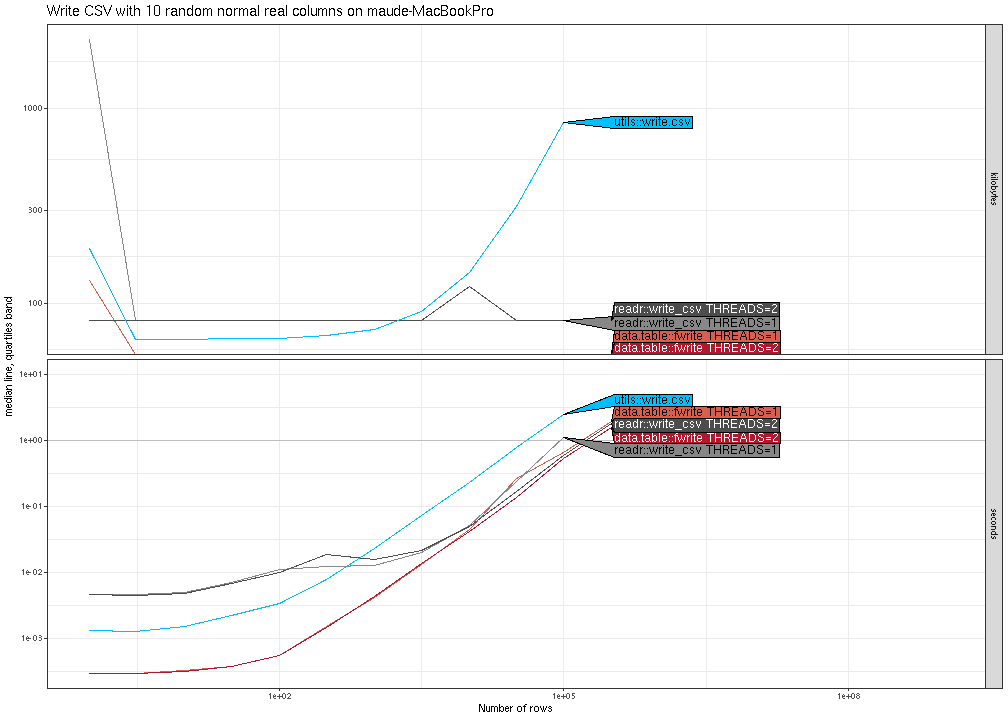
(N^2). The plot below shows similar trends for writing real columns.
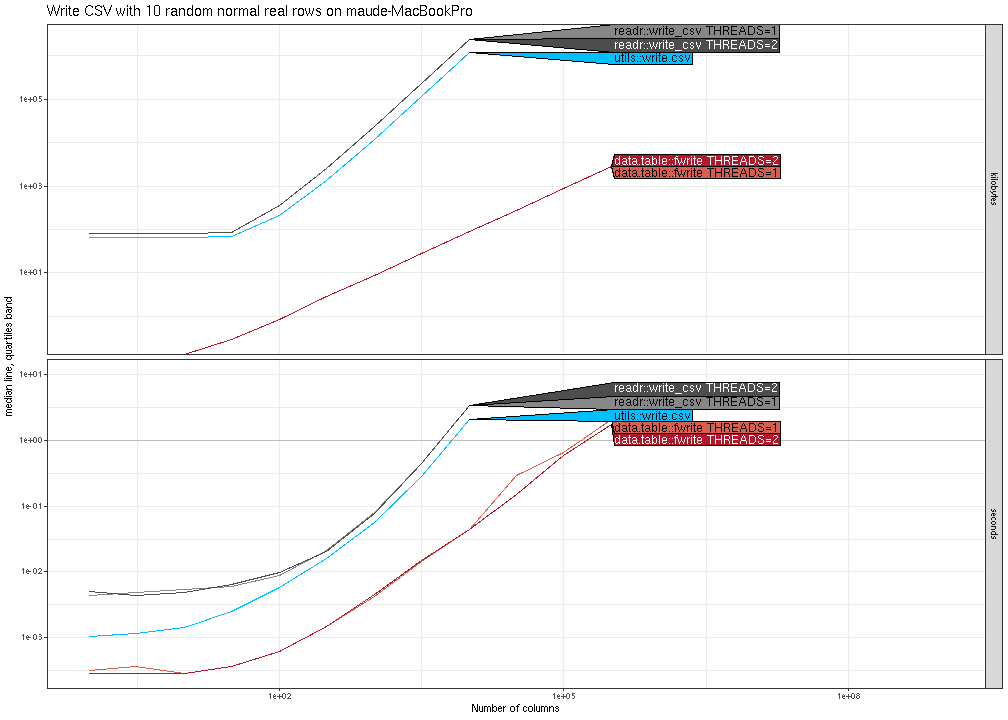
Finally, the plot below shows that all methods are asymptotically
similar (linear time and constant memory), except utils::write.csv()
has much larger memory usage.
Conclusion
Asymptotic performance testing is useful for identifying parts of code which can be improved in terms of time or memory usage. We have identified sub-optimal asymptotic complexity in the following functions:
utils::read.csv()could improve time usage, for large numbers of columns, https://github.com/tdhock/atime/issues/8.utils::write.csv()andreadr::write_csv()could improve both time and memory usage, for large numbers of columns, https://github.com/tdhock/atime/issues/9.utils::write.csv()memory usage could be improved, for large number of rows, https://github.com/tdhock/atime/issues/10.
We observed that data.table::fread() and data.table::fwrite()
provide implementations of CSV reading/writing that are asymptotically
optimal, in terms of both time and memory usage. For future work, we
would like to create examples that more clearly show how
multi-threading could be used for speed improvements.
UPDATE 26 June 2023: Sebastian Meyer and Gabe Becker have helped to
fix some of the issues in write.csv (and a related issue with
replacing columns of data frames), which are available starting with
R-4.3.0 (released 21 April 2023). I have computed the benchmarks above
using several versions of R, for reproducibility:
- R-4.2.3,
which was the version of R used to create the figures above, the
last release version with
write.csvthat is quadratic in the number of columns. - R-4.3.0,
which was the first release of R with
write.csvthat is linear in the number of columns. - the most recent release of R, to check when/if the other issues are solved.
- To re-run benchmarks we can use the code below:
th798@wind:~$ srun -t 24:00:00 --mem=32GB --cpus-per-task=4 --pty bash          srun: job 64668716 queued and waiting for resources
srun: job 64668716 has been allocated resources
th798@cn63:~$ module load anaconda3
th798@cn63:~$ conda activate emacs1
(emacs1) th798@cn63:~$ R -e 'rmarkdown::render("~/R/atime/vignettes/compare-data.table-tidyverse.Rmd")'