Generalization to new subsets
A number of students have asked me how to properly code cross-validation, in order to compare generalization / accuracy of different machine learning algorithms, when trained on different data sets. For example in one project, a student is trying to build an algorithm for satellite image segmentation. For each pixel in each image, there should be a predicted class, which represents the intensity of forest fire burn in that area of the image. The student has about 10000 rows (pixels with labels), where each row comes from one of 9 different images. I suggested the following cross-validation experiment to determine the extent to which prediction error increases when generalizing to new images.
Let’s say there are 1000 rows,
import pandas as pd
import numpy as np
N = 1000
full_df = pd.DataFrame({
    "label":np.tile(["burned","no burn"],int(N/2)),
    "image":np.concatenate([
        np.repeat(1, 0.4*N), np.repeat(2, 0.4*N),
        np.repeat(3, 0.1*N), np.repeat(4, 0.1*N)
    ])
})
len_series = full_df.groupby("image").apply(len)
uniq_images = full_df.image.unique()
n_images = len(uniq_images)
full_df["signal"] = np.where(
    full_df.label=="no burn", 0, 1
)*full_df.image
full_df
##        label  image  signal
## 0     burned      1       1
## 1    no burn      1       0
## 2     burned      1       1
## 3    no burn      1       0
## 4     burned      1       1
## ..       ...    ...     ...
## 995  no burn      4       0
## 996   burned      4       4
## 997  no burn      4       0
## 998   burned      4       4
## 999  no burn      4       0
##
## [1000 rows x 3 columns]
Above each row has an image ID between 1 and 4. We also generate/simulate some features:
np.random.seed(1)
for n_noise in range(n_images-1):
    full_df["feature_easy_%s"%n_noise] = np.random.randn(N)
full_df["feature_easy_%s"%n_images] = np.random.randn(N)+full_df.signal
for img in uniq_images:
    noise = np.random.randn(N)
    full_df["feature_impossible_%s"%img] = np.where(
        full_df.image == img, full_df.signal+noise, noise)
There are two sets of four features:
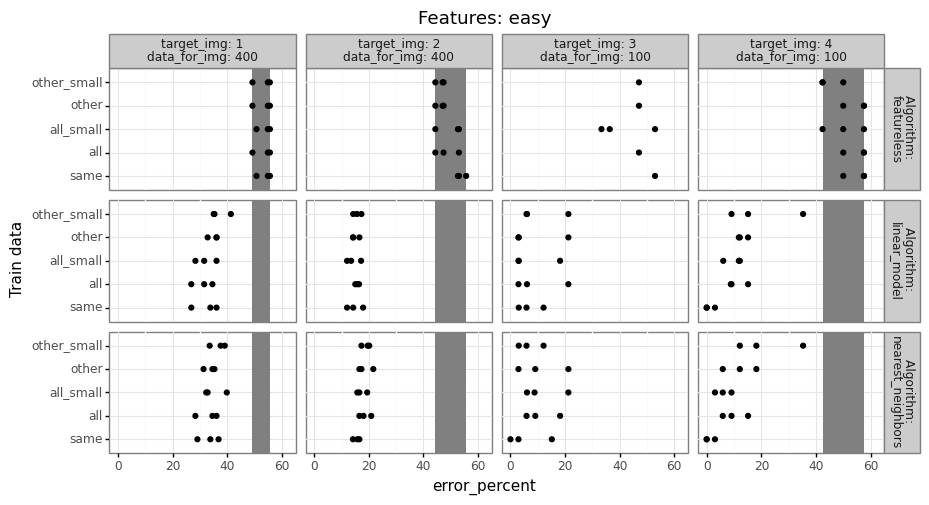
- For easy features, three are random noise, and one is correlated with the label.
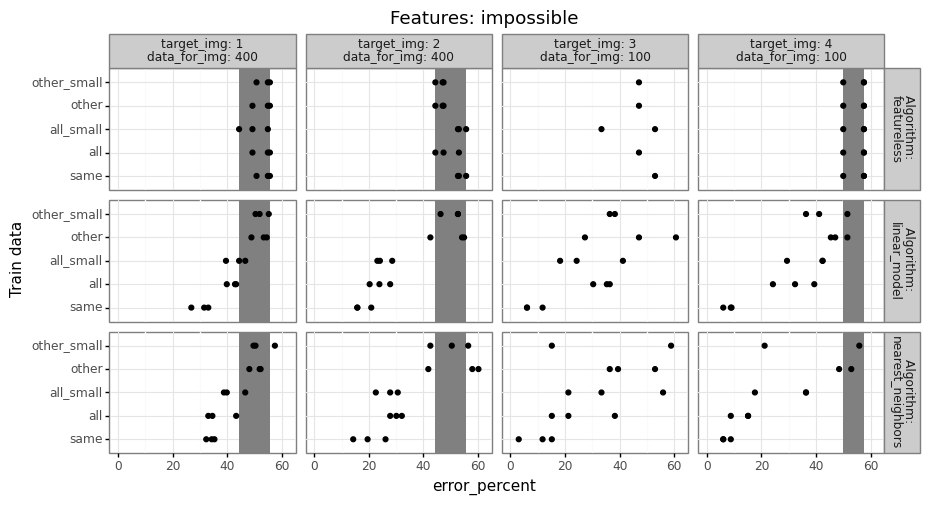
- Each impossible feature is correlated with the label (when feature number same as image number), or is just noise (when image number different from feature number).
The signal is stronger for larger image numbers (image number 4 is easier to learn from than image number 1).
We would like to fix a test image, and then compare models trained on either the same image, or on different images (or all images). To create a K-fold cross-validation experiment (say K=3 folds), we therefore need to assign fold IDs in a way such that each image is present in each fold. One way to do that would be to just use random integers,
n_folds = 3
np.random.seed(1)
full_df["random_fold"] = np.random.randint(1, n_folds+1, size=N)
pd.crosstab(full_df["random_fold"], full_df["image"])
## image          1    2   3   4
## random_fold
## 1            144  134  28  28
## 2            132  120  38  39
## 3            124  146  34  33
In the output above we see that for each image, there is not an equal number of data assigned to each fold. How could we do that?
import math
def get_fold_ids(some_array):
    n_out = len(some_array)
    arange_vec = np.arange(n_folds)
    tile_vec = np.tile(arange_vec, math.ceil(n_out/n_folds))[:n_out]
    return pd.DataFrame({
        "fold":np.random.permutation(tile_vec),
        })
np.random.seed(1)
new_fold_df = full_df.groupby("image").apply(get_fold_ids)
full_df["fold"] = new_fold_df.reset_index().fold
full_df
##        label  image  signal  ...  feature_impossible_4  random_fold  fold
## 0     burned      1       1  ...              0.920079            2     2
## 1    no burn      1       0  ...              0.018099            1     2
## 2     burned      1       1  ...              1.475869            1     1
## 3    no burn      1       0  ...              0.373199            2     0
## 4     burned      1       1  ...              1.295183            2     1
## ..       ...    ...     ...  ...                   ...          ...   ...
## 995  no burn      4       0  ...             -0.381307            2     0
## 996   burned      4       4  ...              5.036886            3     0
## 997  no burn      4       0  ...              0.671736            2     0
## 998   burned      4       4  ...              4.510561            1     1
## 999  no burn      4       0  ...              1.006131            2     2
##
## [1000 rows x 13 columns]
pd.crosstab(full_df.fold, full_df.image)
## image    1    2   3   4
## fold
## 0      134  134  34  34
## 1      133  133  33  33
## 2      133  133  33  33
The table above shows that for each image, the number of data per fold is equal (or off by one).
We can use these fold IDs with GroupKFold from Scikit-learn:
from sklearn.model_selection import GroupKFold
gkf = GroupKFold(n_splits=n_folds)
for test_fold, index_tup in enumerate(gkf.split(full_df, groups=full_df.fold)):
    set_indices = dict(zip(["train","test"], index_tup))
    for set_name, index_array in set_indices.items():
        set_df = full_df.iloc[index_array]
        print("\nfold=%s, set=%s"%(test_fold,set_name))
        print(pd.crosstab(set_df.fold, set_df.image))
##
## fold=0, set=train
## image    1    2   3   4
## fold
## 1      133  133  33  33
## 2      133  133  33  33
##
## fold=0, set=test
## image    1    2   3   4
## fold
## 0      134  134  34  34
##
## fold=1, set=train
## image    1    2   3   4
## fold
## 0      134  134  34  34
## 1      133  133  33  33
##
## fold=1, set=test
## image    1    2   3   4
## fold
## 2      133  133  33  33
##
## fold=2, set=train
## image    1    2   3   4
## fold
## 0      134  134  34  34
## 2      133  133  33  33
##
## fold=2, set=test
## image    1    2   3   4
## fold
## 1      133  133  33  33
The output above indicates that there are equal proportions of each image in each set (train and test). So we can fix a test fold, say 2, and also a test image, say 4. Then there are 33 data points in that test set. We can try to predict them by using machine learning algorithms on several different train sets:
- same: train folds (0 and 1) and same image (4), there are 34+33=67 train data in this set.
- other: train folds (0 and 1) and other images (1-3), there are 601 train data in this set.
- all: train folds (0 and 1) and all images (1-4), there are 668 train data in this set.
For each of the three trained models, we compute prediction error on the test set (image 4, fold 2), then compare the error rates to determine how much error changes when we train on a different set of images.
- Because there are relatively few data from image 4, it may be beneficial to train on a larger data set (including images 1-3), even if those data are somewhat different. (and other/all error may actually be smaller than same error)
- Conversely, if the data in images 1-3 are substantially different, then it may not help at all to use different images. (in this case, same error would be smaller than other/all error)
Typically if there are a reasonable number of train data, the same model should do better than other/all, but you have to do the computational experiment to find out what is true for your particular data set. The code to do that should look something like below,
from sklearn.model_selection import GroupKFold
gkf = GroupKFold(n_splits=n_folds)
from sklearn.linear_model import LogisticRegressionCV
from sklearn.model_selection import GridSearchCV
from sklearn.neighbors import KNeighborsClassifier
cache_csv = fig_path+"cache.csv"
if os.path.exists(cache_csv):
    error_df = pd.read_csv(cache_csv)
else:
    error_df_list = []
    extract_df = full_df.columns.str.extract("feature_(?P<type>[^_]+)")
    feature_name_series = extract_df.value_counts().reset_index().type
    for feature_name in feature_name_series:
        is_feature = np.array([feature_name in col for col in full_df.columns])
        for test_fold, index_tup in enumerate(gkf.split(full_df, groups=full_df.fold)):
            index_dict = dict(zip(["all_train","all_test"], index_tup))
            df_dict = {
                set_name:full_df.iloc[index_array]
                for set_name, index_array in index_dict.items()}
            for target_img in full_df.image.unique():
                is_same_dict = {
                    set_name:set_df.image == target_img
                    for set_name, set_df in df_dict.items()}
                df_dict["test"] = df_dict["all_test"].loc[ is_same_dict["all_test"], :]
                is_same_values_dict = {
                    "all":[True,False],
                    "same":[True],
                    "other":[False],
                    }
                train_name_list = []
                for data_name, is_same_values in is_same_values_dict.items():
                    train_name_list.append(data_name)
                    train_is_same = is_same_dict["all_train"].isin(is_same_values)
                    df_dict[data_name] = df_dict["all_train"].loc[train_is_same,:]
                same_nrow, same_ncol = df_dict["same"].shape
                for data_name in "all", "other":
                    small_name = data_name+"_small"
                    train_name_list.append(small_name)
                    train_df = df_dict[data_name]
                    all_indices = np.arange(len(train_df))
                    small_indices = np.random.permutation(all_indices)[:same_nrow]
                    df_dict[small_name] = train_df.iloc[small_indices,:]
                xy_dict = {
                    data_name:(df.loc[:,is_feature], df.label)
                    for data_name, df in df_dict.items()}
                test_X, test_y = xy_dict["test"]
                for train_name in train_name_list:
                    train_X, train_y = xy_dict[train_name]
                    param_dicts = [{'n_neighbors':[x]} for x in range(1, 21)]
                    learner_dict = {
                        "linear_model":LogisticRegressionCV(),
                        "nearest_neighbors":GridSearchCV(
                            KNeighborsClassifier(), param_dicts)
                        }
                    featureless_pred = train_y.value_counts().index[0]
                    pred_dict = {
                        "featureless":np.repeat(featureless_pred, len(test_y)),
                    }
                    for algorithm, learner in learner_dict.items():
                        learner.fit(train_X, train_y)
                        pred_dict[algorithm] = learner.predict(test_X)
                    for algorithm, pred_vec in pred_dict.items():
                        error_vec = pred_vec != test_y
                        out_df=pd.DataFrame({
                            "feature_name":[feature_name],
                            "test_fold":[test_fold],
                            "target_img":[target_img],
                            "data_for_img":[len_series[target_img]],
                            "test_nrow":[len(test_y)],
                            "train_nrow":[len(train_y)],
                            "train_name":[train_name],
                            "algorithm":[algorithm],
                            "error_percent":[error_vec.mean()*100],
                            })
                        print(out_df)
                        error_df_list.append(out_df)
    error_df = pd.concat(error_df_list)
    error_df.to_csv(cache_csv)
error_df
##      Unnamed: 0 feature_name  ...          algorithm  error_percent
## 0             0         easy  ...        featureless      49.253731
## 1             0         easy  ...       linear_model      26.865672
## 2             0         easy  ...  nearest_neighbors      28.358209
## 3             0         easy  ...        featureless      50.746269
## 4             0         easy  ...       linear_model      26.865672
## ..          ...          ...  ...                ...            ...
## 355           0   impossible  ...       linear_model      42.424242
## 356           0   impossible  ...  nearest_neighbors      36.363636
## 357           0   impossible  ...        featureless      57.575758
## 358           0   impossible  ...       linear_model      36.363636
## 359           0   impossible  ...  nearest_neighbors      21.212121
##
## [360 rows x 10 columns]
The result table above has a row for every combination of features,
test fold, target image, ane train data name
(all/other/same). Exercise for the reader: fill in the TODO with some
actual prediction error values from a real data set. You should have
one more for loop over learning algorithms (and a corresponding column
in out_df). Try at least featureless (always predict most frequent
class in train data), linear model, and nearest neighbors, as in my
Deep Learning class homework
2.
import plotnine as p9
train_name_order=["same", "all", "all_small", "other", "other_small"]
def gg_error(feature_name):
    feature_df = error_df.query("feature_name == '%s'"%feature_name).copy()
    featureless = feature_df.query("algorithm=='featureless'")
    grouped = featureless.groupby(
        ['target_img', 'data_for_img']
    )["error_percent"]
    min_max_df = grouped.apply(lambda df: pd.DataFrame({
        "xmin":[df.min()],
        "xmax":[df.max()],
        "ymin":[-np.inf],
        "ymax":[np.inf],
    })).reset_index()
    feature_df["Algorithm"] = "\n"+feature_df.algorithm
    feature_df["Train data"] = pd.Categorical(
        feature_df.train_name, train_name_order)
    gg = p9.ggplot()+\
        p9.theme_bw()+\
        p9.theme(panel_spacing=0.1)+\
        p9.theme(figure_size=(10,5))+\
        p9.geom_rect(
            p9.aes(
                xmin="xmin",
                xmax="xmax",
                ymin="ymin",
                ymax="ymax"
                ),
            fill="grey",
            data=min_max_df)+\
        p9.geom_point(
            p9.aes(
                x="error_percent",
                y="Train data"
            ),
        data=feature_df)+\
        p9.scale_x_continuous(limits=[0,62])+\
        p9.facet_grid("Algorithm ~ target_img + data_for_img", labeller="label_both")+\
        p9.ggtitle("Features: "+feature_name)
    p9_save(gg, feature_name)
gg_error("easy")
gg_error("impossible")