atime gallery
This is a gallery of interactive data visualizations, created using the R package animint2, related to results computed using atime.
| viz.link | title | links |
|---|---|---|
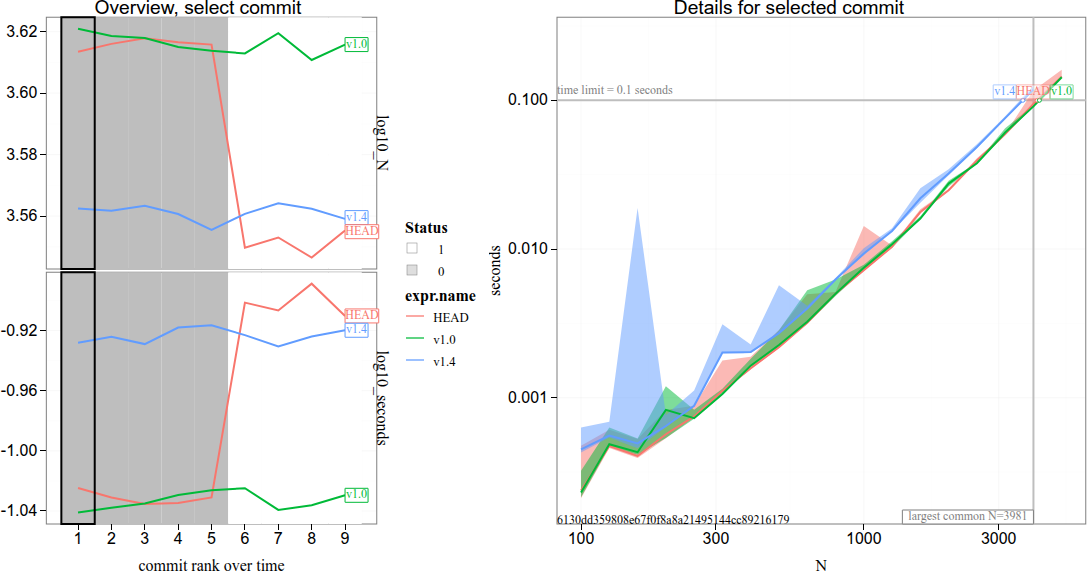 |
git bisect results for ponca asoCurveEstimation | repo source NA |
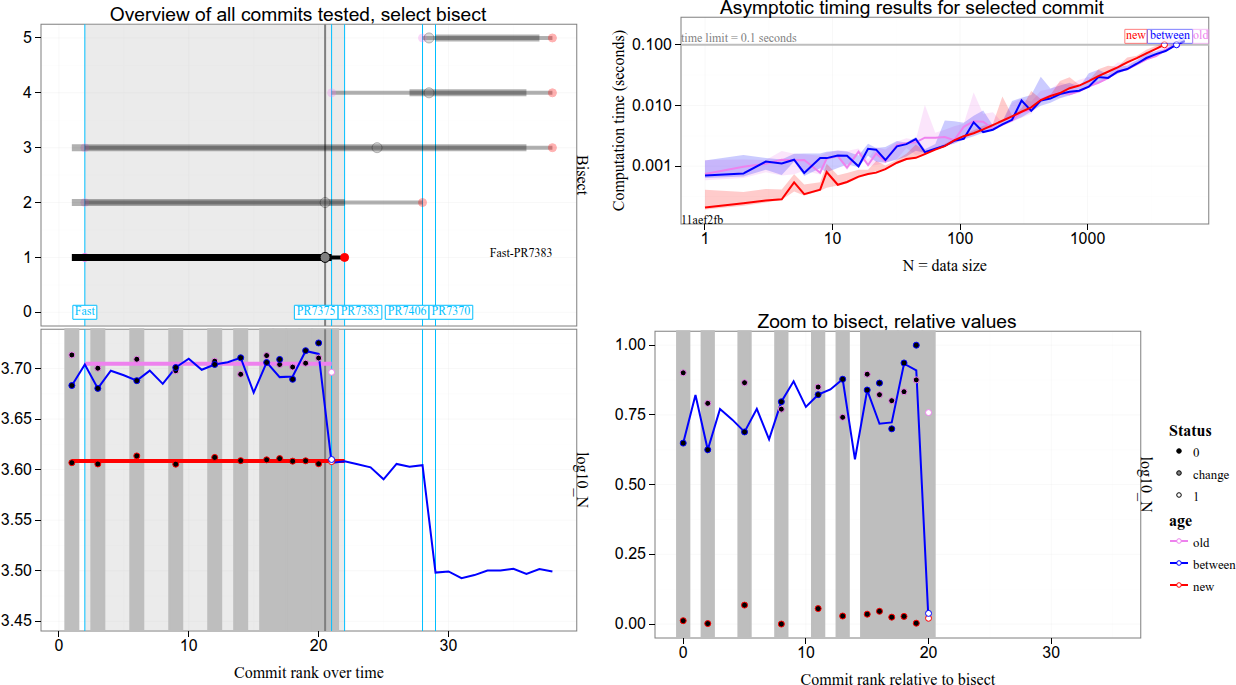 |
data.table git bisect performance analysis for PR7907 | repo source NA |
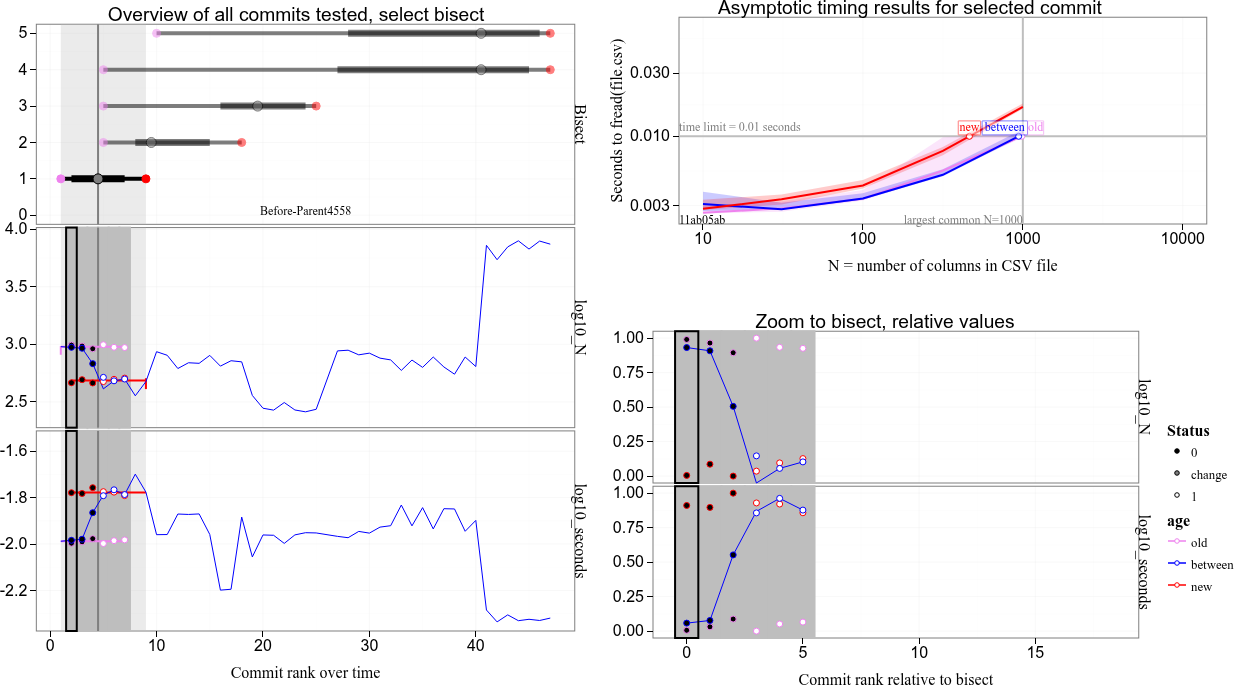 |
data.table git bisect performance analysis for PR7912, 0.01 sec time limit, N on log10 scale | repo source NA |
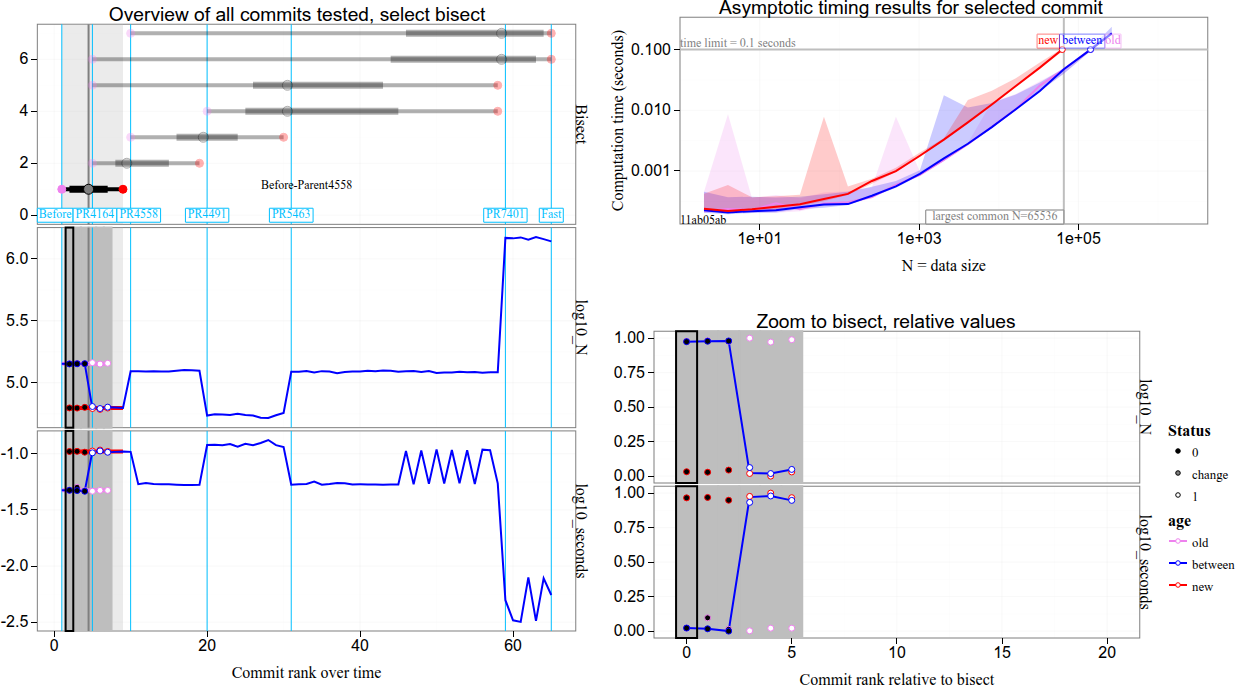 |
data.table git bisect performance analysis for PR7912, 0.01 sec time limit, N on log10 scale | repo source NA |
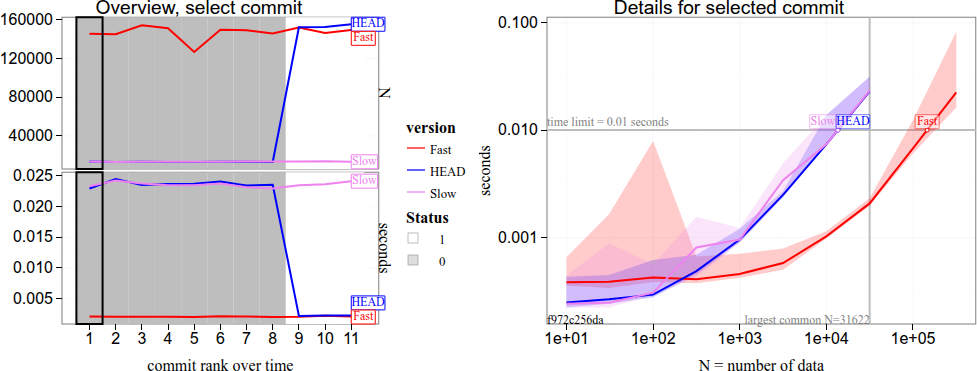 |
Performance testing with git bisect in data.table DT_by__fixed_in__4558_Slow_Fast | repo source NA |
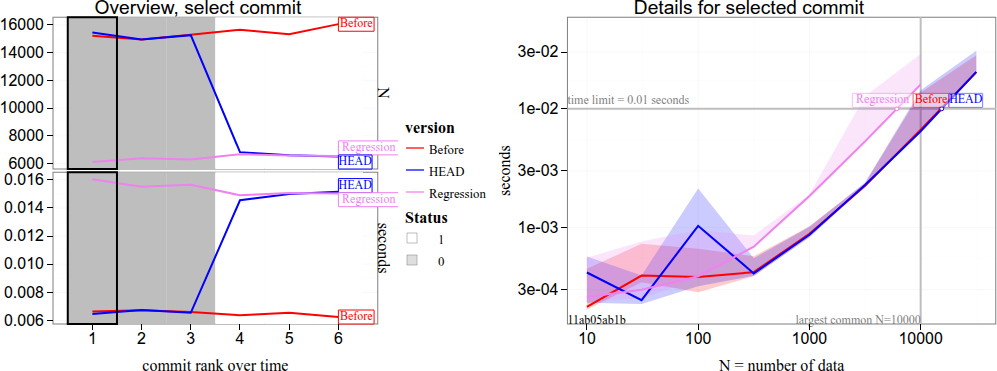 |
Performance testing with git bisect in data.table DT_by__fixed_in__4558_Before_Regression | repo source NA |
 |
Identifying data.table::fread() performance regressions with atime and git bisect | repo source NA |