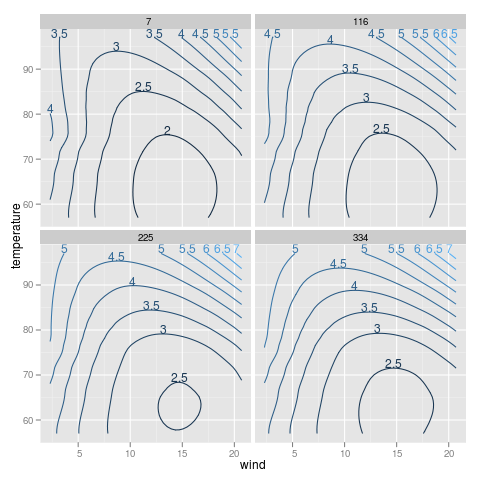
Positioning Method for the bottom of a group of points.
direct.label(p,"bottom.pieces")
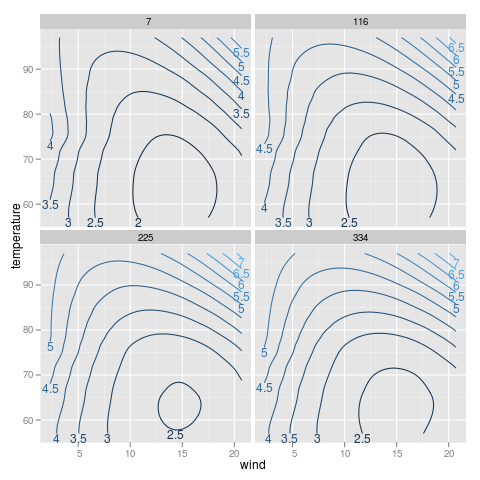
Positioning Method for the top of a group of points.
direct.label(p,"top.pieces")
## Example from help(contourplot)
require(stats)
require(lattice)
attach(environmental)
ozo.m <- loess((ozone^(1/3)) ~ wind * temperature * radiation,
               parametric = c("radiation", "wind"), span = 1, degree = 2)
w.marginal <- seq(min(wind), max(wind), length.out = 50)
t.marginal <- seq(min(temperature), max(temperature), length.out = 50)
r.marginal <- seq(min(radiation), max(radiation), length.out = 4)
wtr.marginal <- list(wind = w.marginal, temperature = t.marginal,
                     radiation = r.marginal)
grid <- expand.grid(wtr.marginal)
grid[, "fit"] <- c(predict(ozo.m, grid))
detach(environmental)
library(ggplot2)
p <- ggplot(grid,aes(wind,temperature,z=fit))+
  stat_contour(aes(colour=..level..))+
  facet_wrap(~radiation)
|
Positioning Method for the bottom of a group of points. direct.label(p,"bottom.pieces") |
|
Positioning Method for the top of a group of points. direct.label(p,"top.pieces") |
| Please contact Toby Dylan Hocking if you are using directlabels or have ideas to contribute, thanks! |
| Documentation website generated from source code version 2021.2.24 (git revision bb6db07 Mon, 14 Jun 2021 22:38:45 +0530) using inlinedocs. |
| validate |